2 Supplementary Material
Supplementary Material
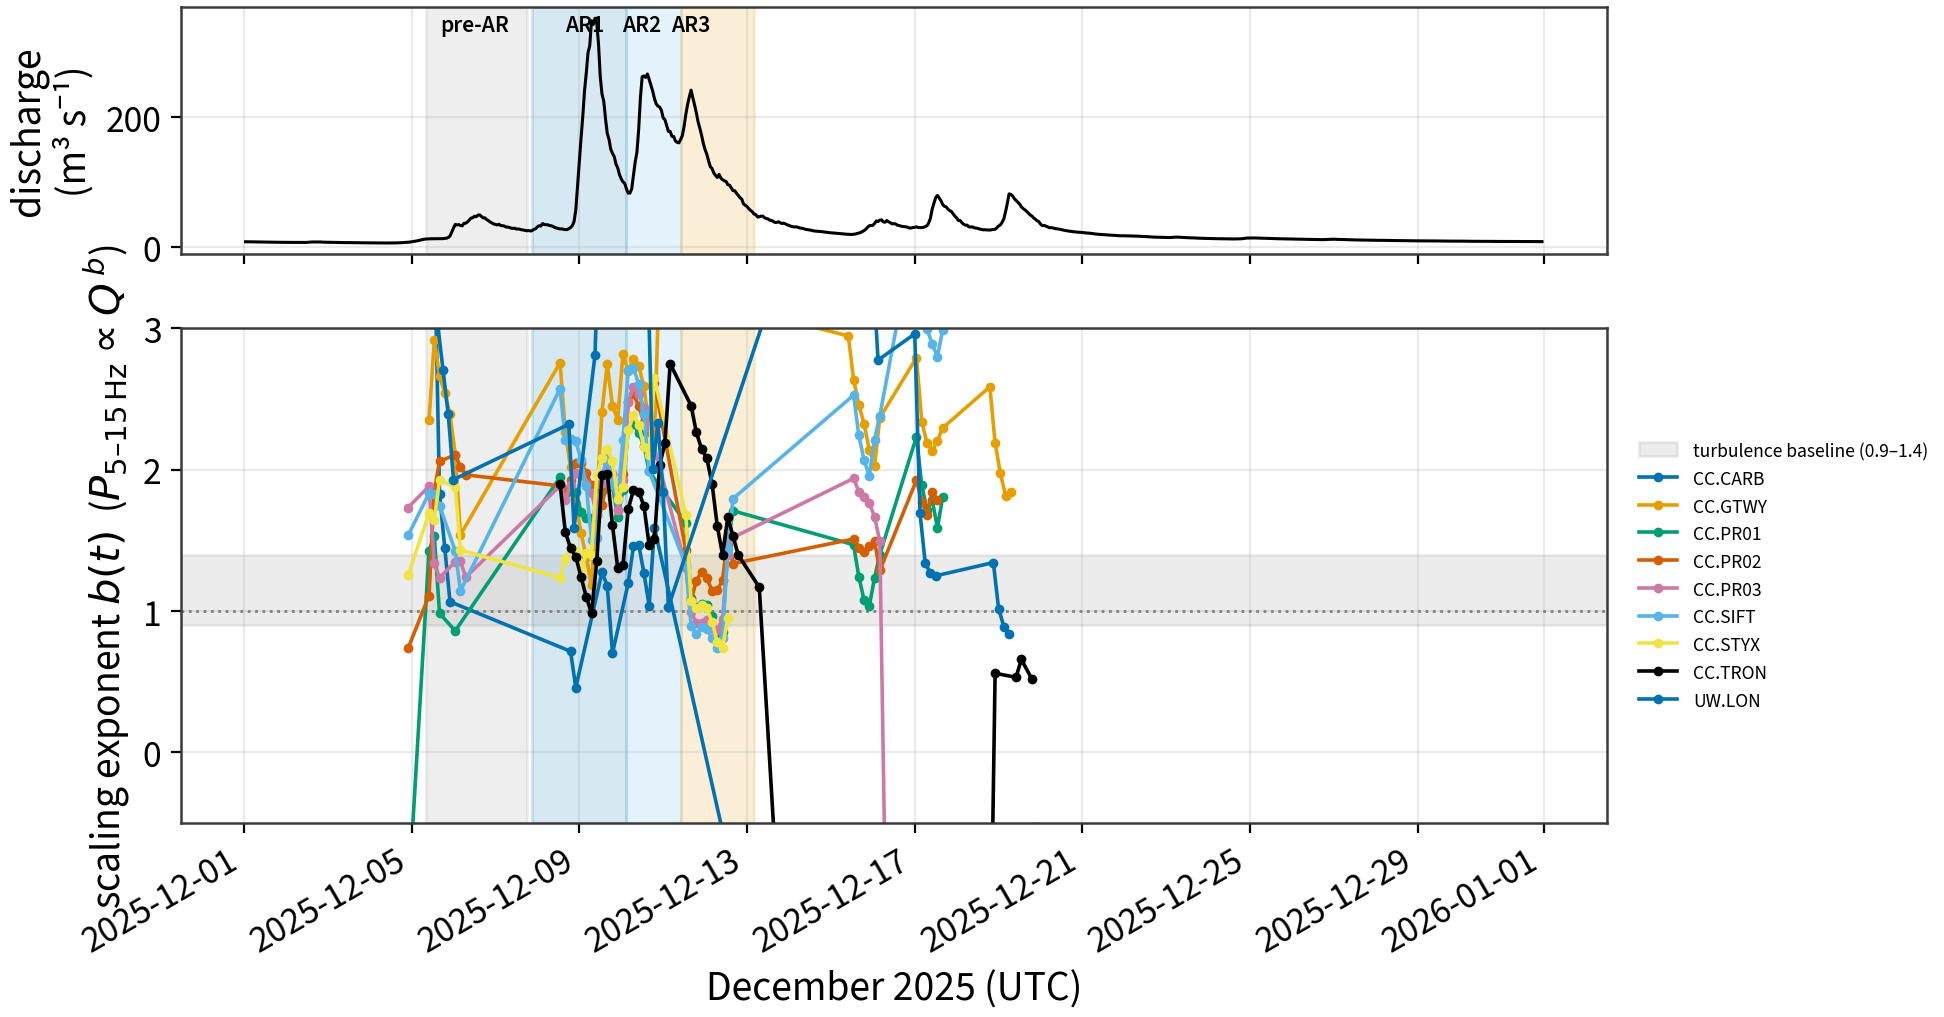
Supporting analyses and figures for “Braided-channel reorganization during storms, resolved seismically.” The main-text cross-references (e.g. Figure 2.6, Figure 2.1) resolve to the figures collected here. In a journal submission these would be renumbered S1–S5; for this rendered book they keep their stable labels.
Text S1 — Anthropogenic-noise screening
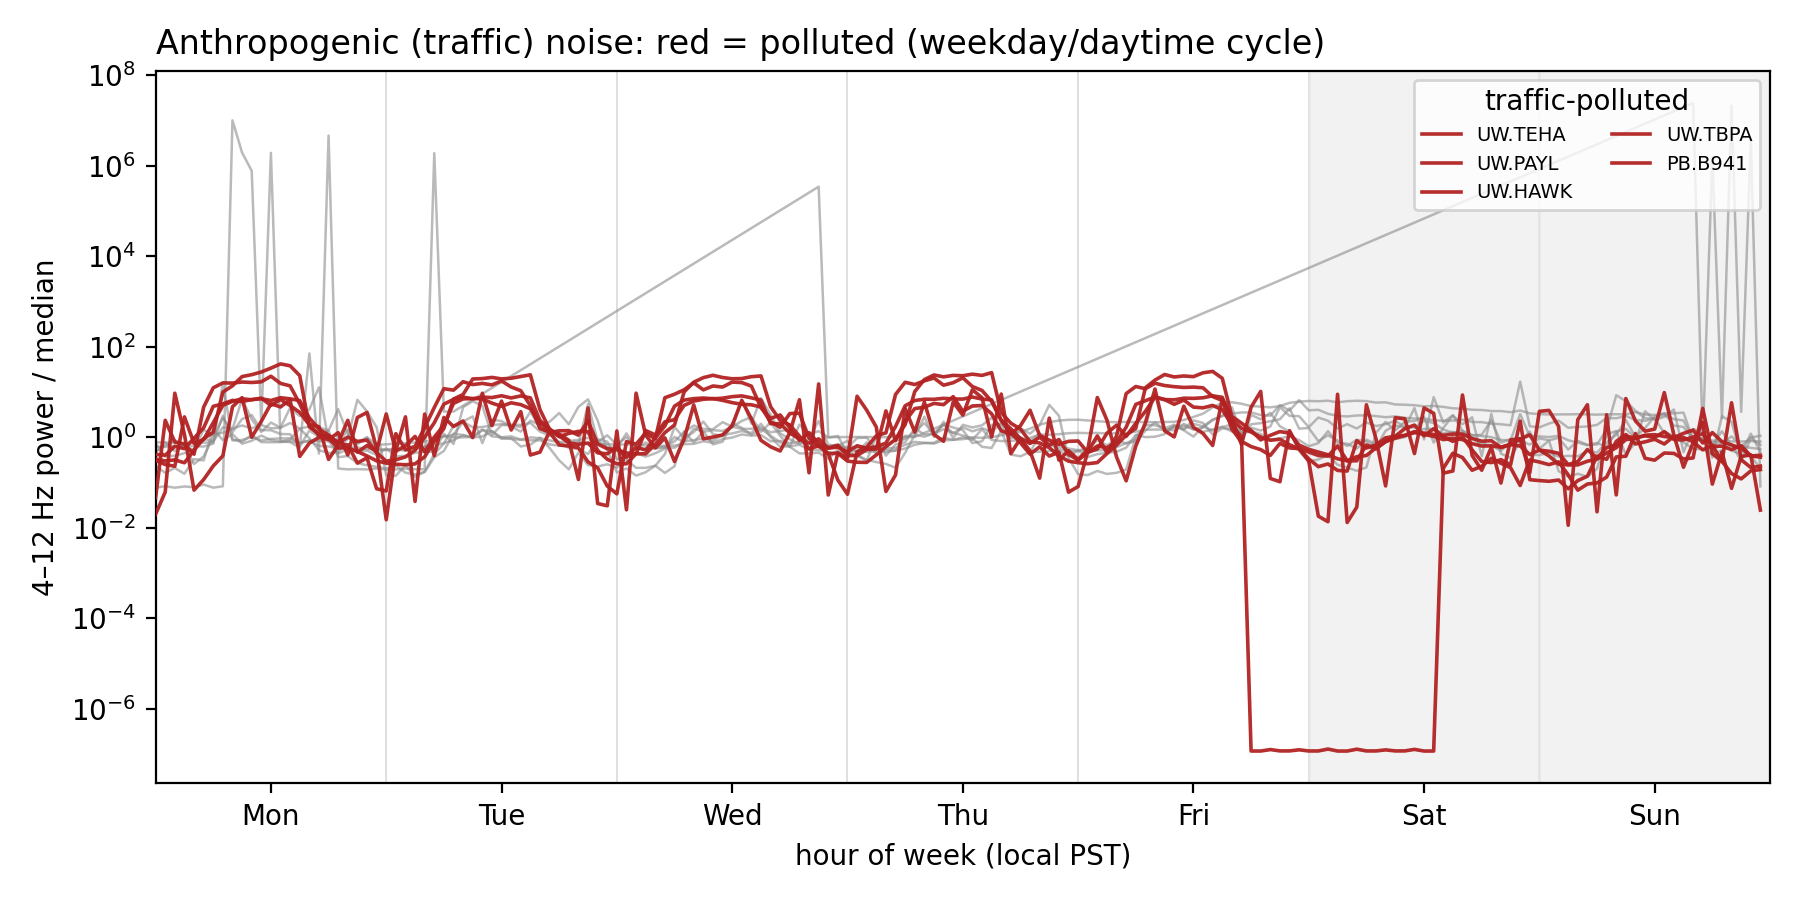
Candidate lowland stations were screened for traffic/cultural contamination over a pre-flood week (1–7 December 2025) by the weekday/daytime-versus-night cycle of 4–12 Hz power (workflows/04_traffic_noise.py). The glacial-source broadband stations are river-dominated (traffic index ≈ 1.3–2.6 and weak diurnal structure), whereas the lowland urban accelerometers carry a strong weekly cycle — UW.TEHA most severely (traffic index ≈ 59; weekday/weekend ≈ 21; correlation with discharge r\approx0). Contaminated stations are excluded from the transect (drawn hollow on Figure 2.1) and from all fits (Figure 2.1).
Text S2 — Flood-wave lag estimation and validation
For a station whose USGS gage is not co-located, gage Q lags the discharge passing the station by the flood-wave travel time. We estimate a constant P–Q lag per station by cross-correlating the limb-timescale (36-h high-passed) components of \log_{10}P and \log_{10}Q — the high pass removes the multi-day storm trend that would otherwise lock the correlation onto spurious large lags — and apply it only where a real travel time exists (gage $$3 km away; a co-located gage returns sub-resolution noise). On the Nisqually (gage 13–21 km downstream) the implied celerities are ≈2 m s⁻¹, physical flood-wave speeds that validate the correction; the Puyallup cluster (gage 0.2–1.9 km) needs none. A constant lag cannot fully align a multi-kilometre path whose celerity varies with stage, which intrinsically limits matched-discharge timing at a far-gaged reach (main text §sec-domain).
Text S3 — Satellite water-threshold ensemble
Turbid braided water sits near MNDWI ≈ 0, so the wetted area — and the predicted geometric baseline drift \Delta\log_{10}P=\log_{10}(W_\text{post}/W_\text{pre}) — is threshold-sensitive. We sweep the MNDWI water threshold over \{-0.10,-0.05,0,+0.05,+0.10\} and report the median and full range per station (error bars on Figure 5.4 c). The sign and rank of the inferred channel migration are robust across the ensemble; the calibrated magnitude is not, and awaits ≈3 m imagery (main text §sec-braided).
Supplementary Figures
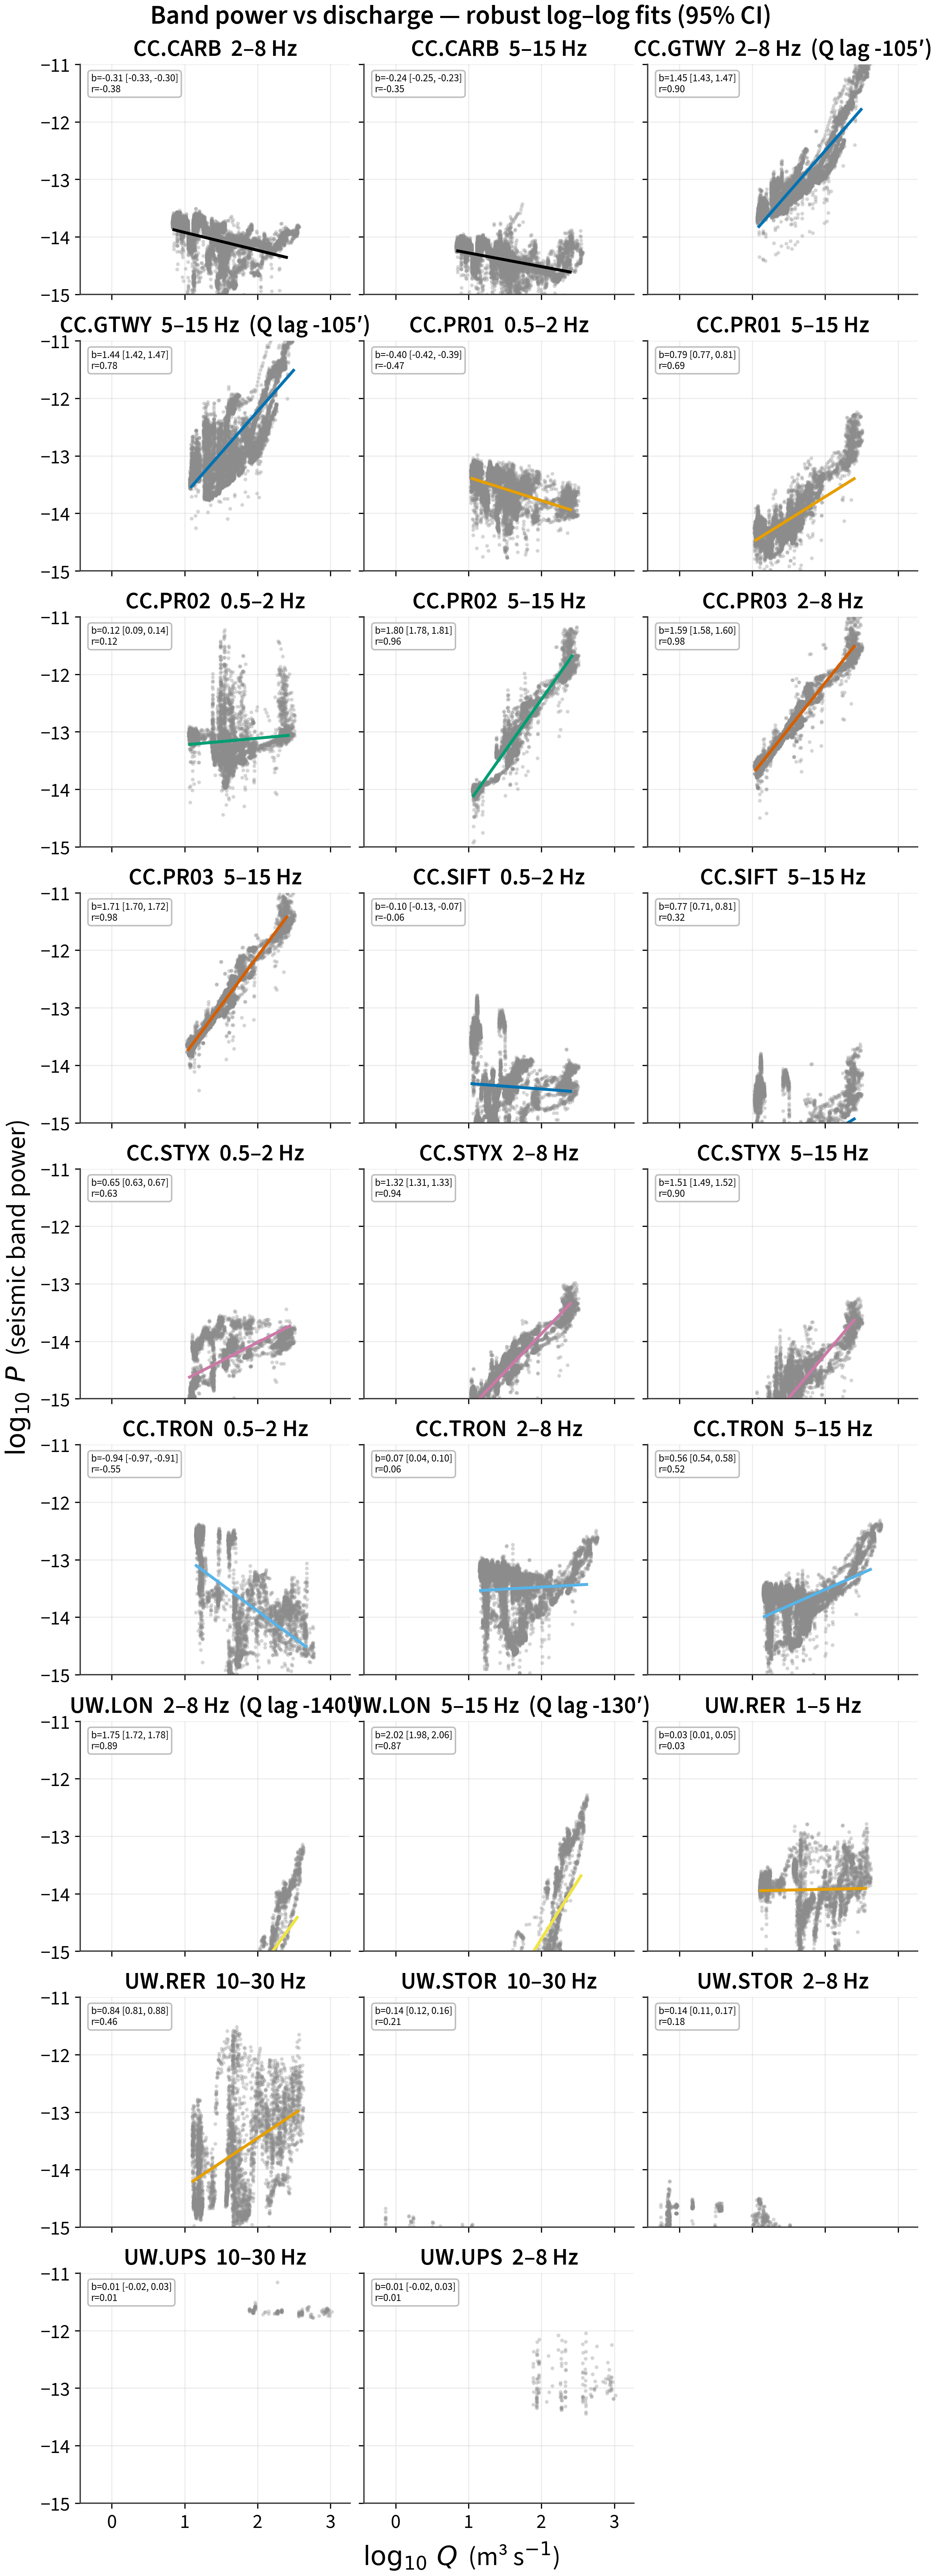
workflows/02_make_figures.py.)
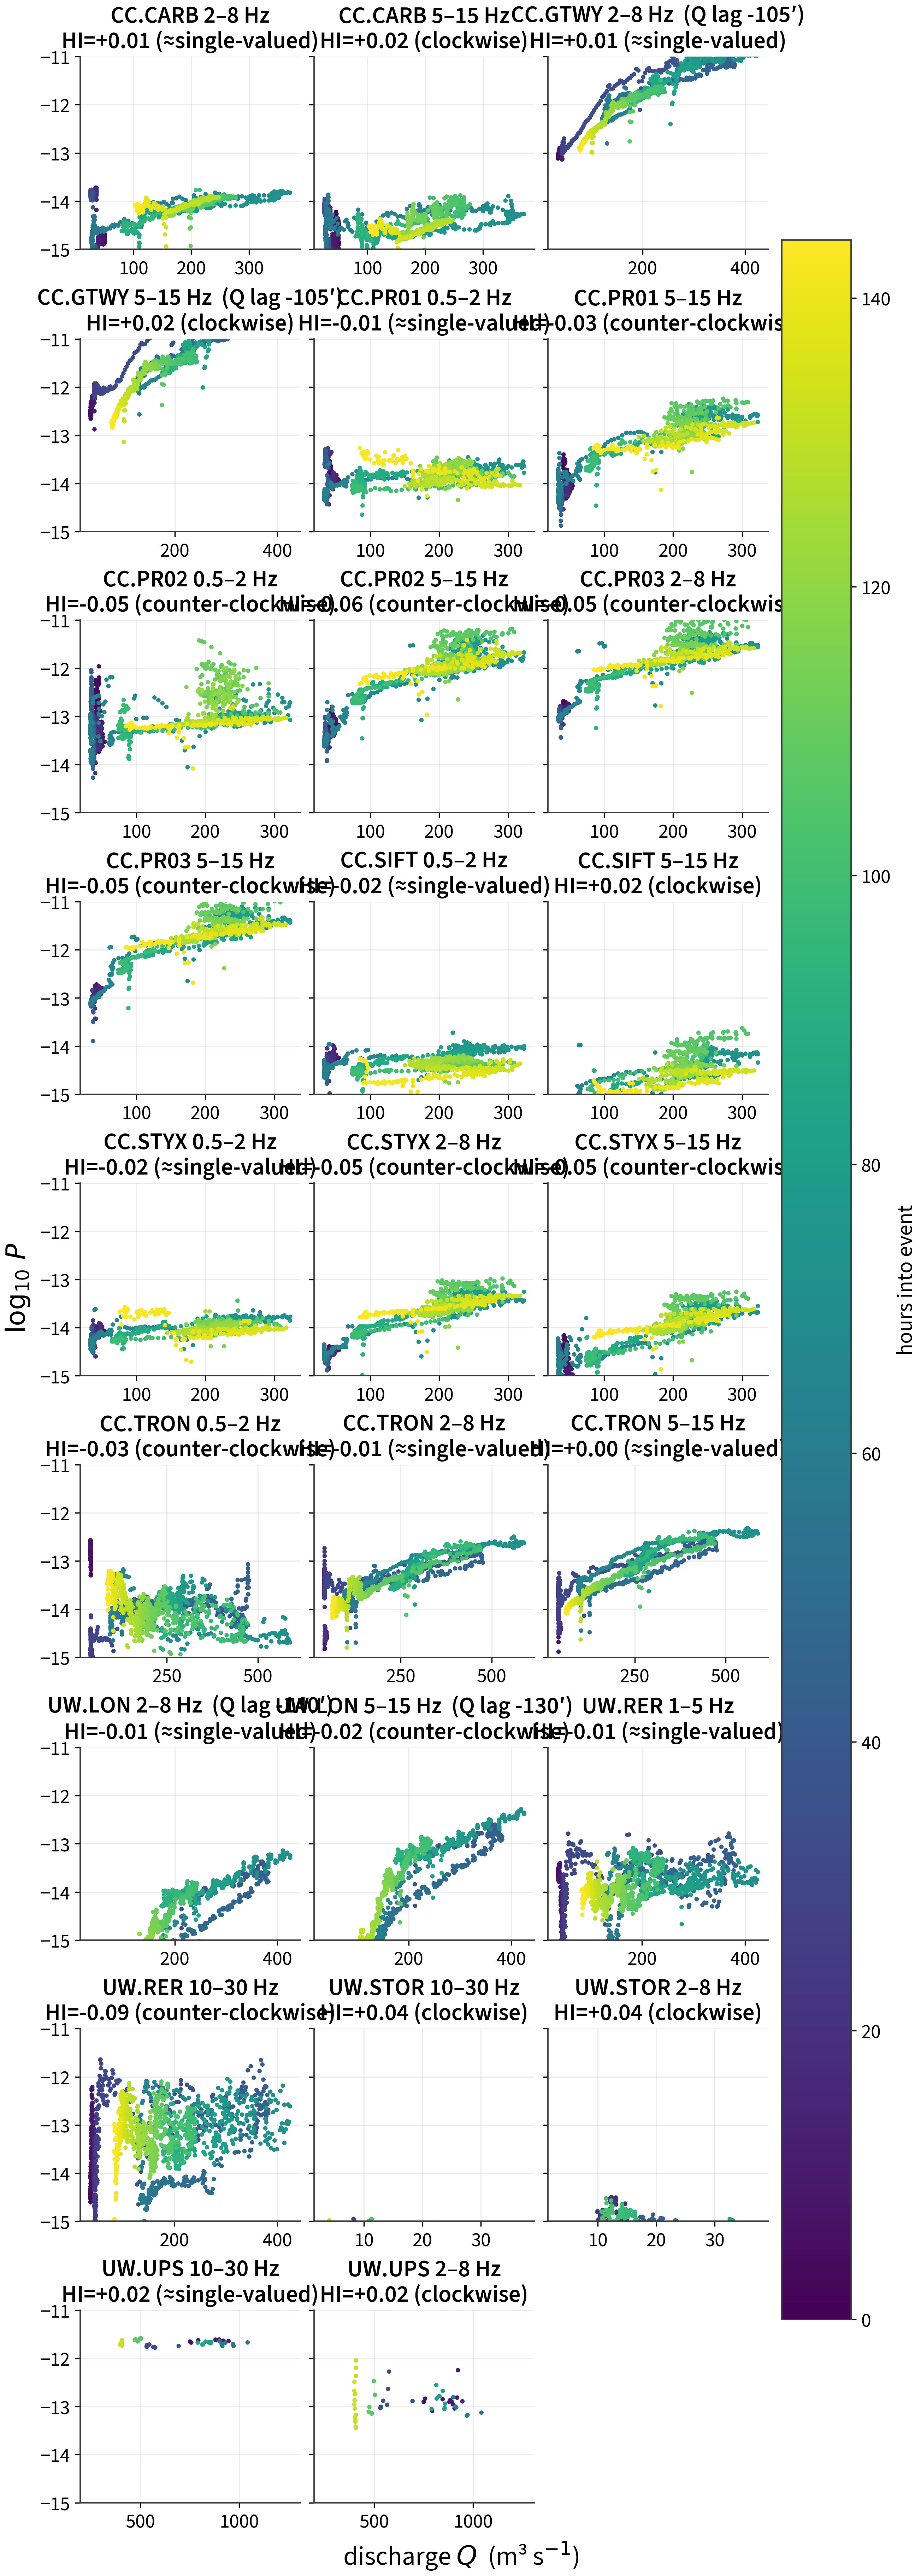
workflows/02_make_figures.py.)
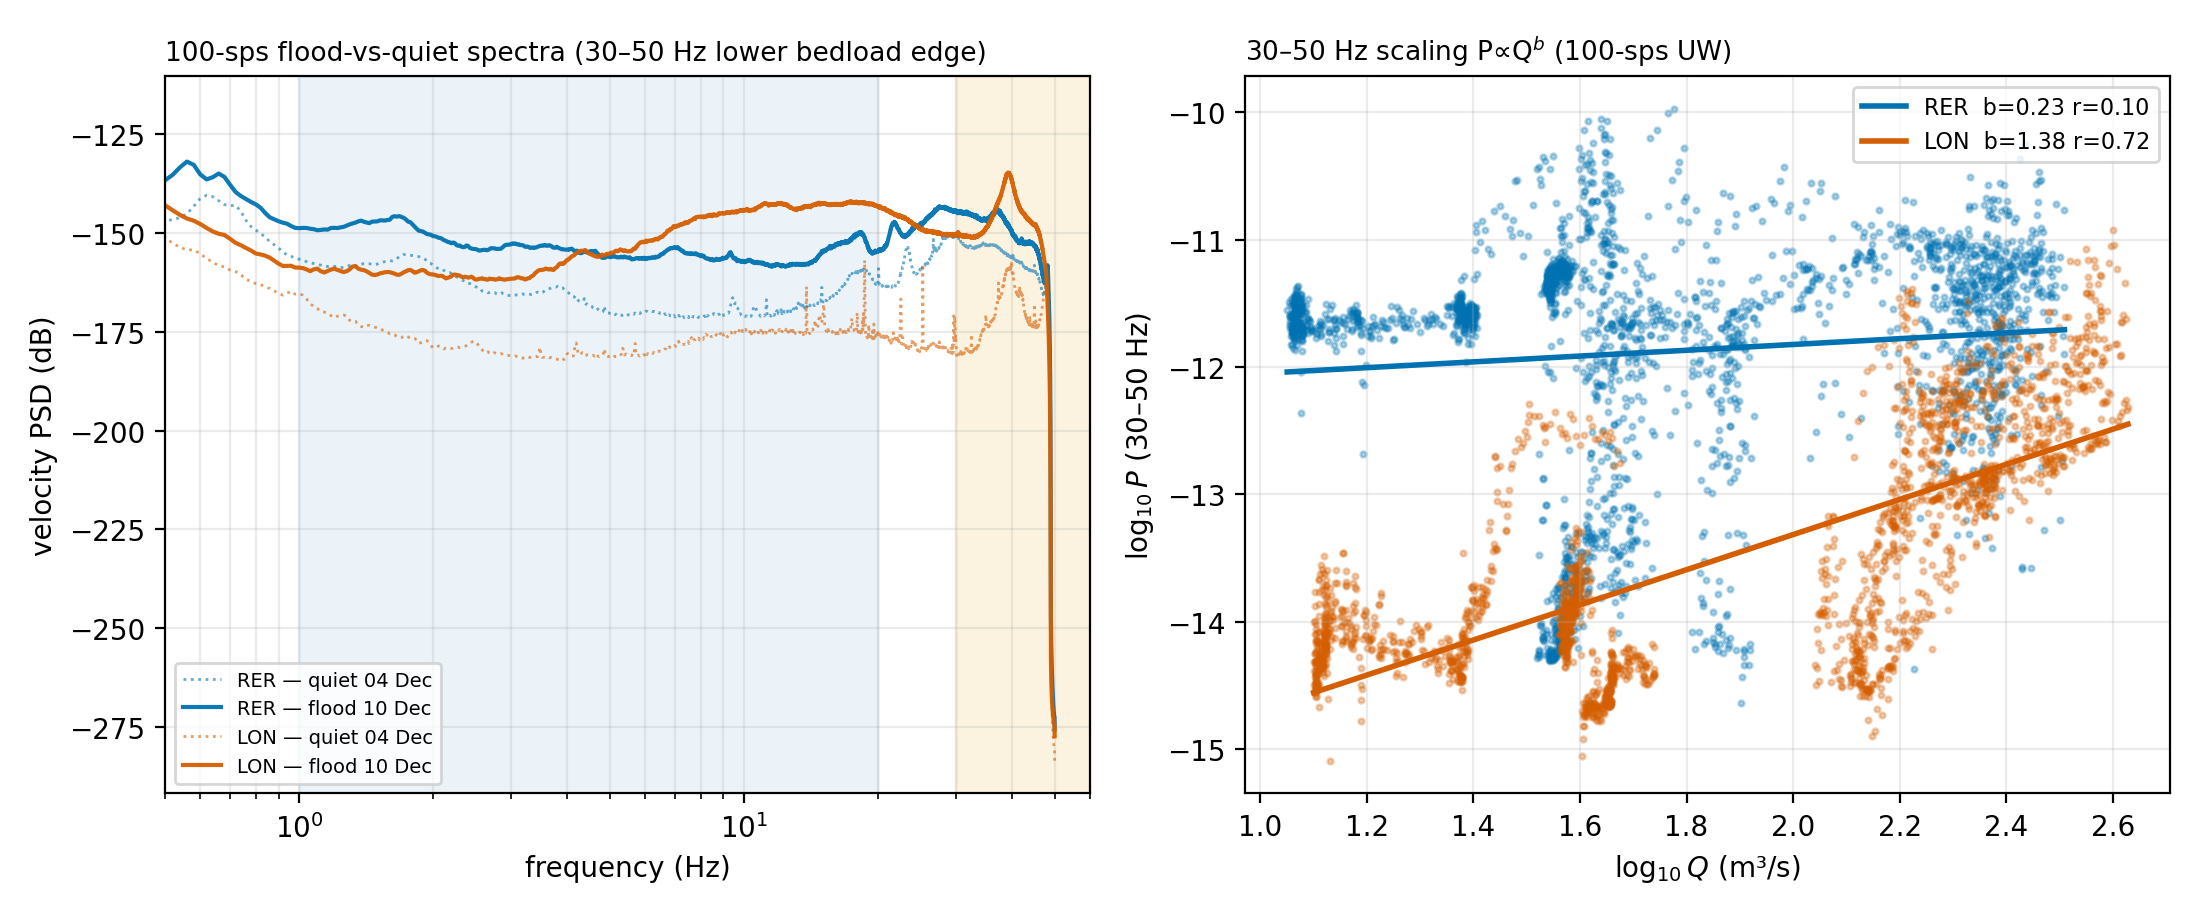
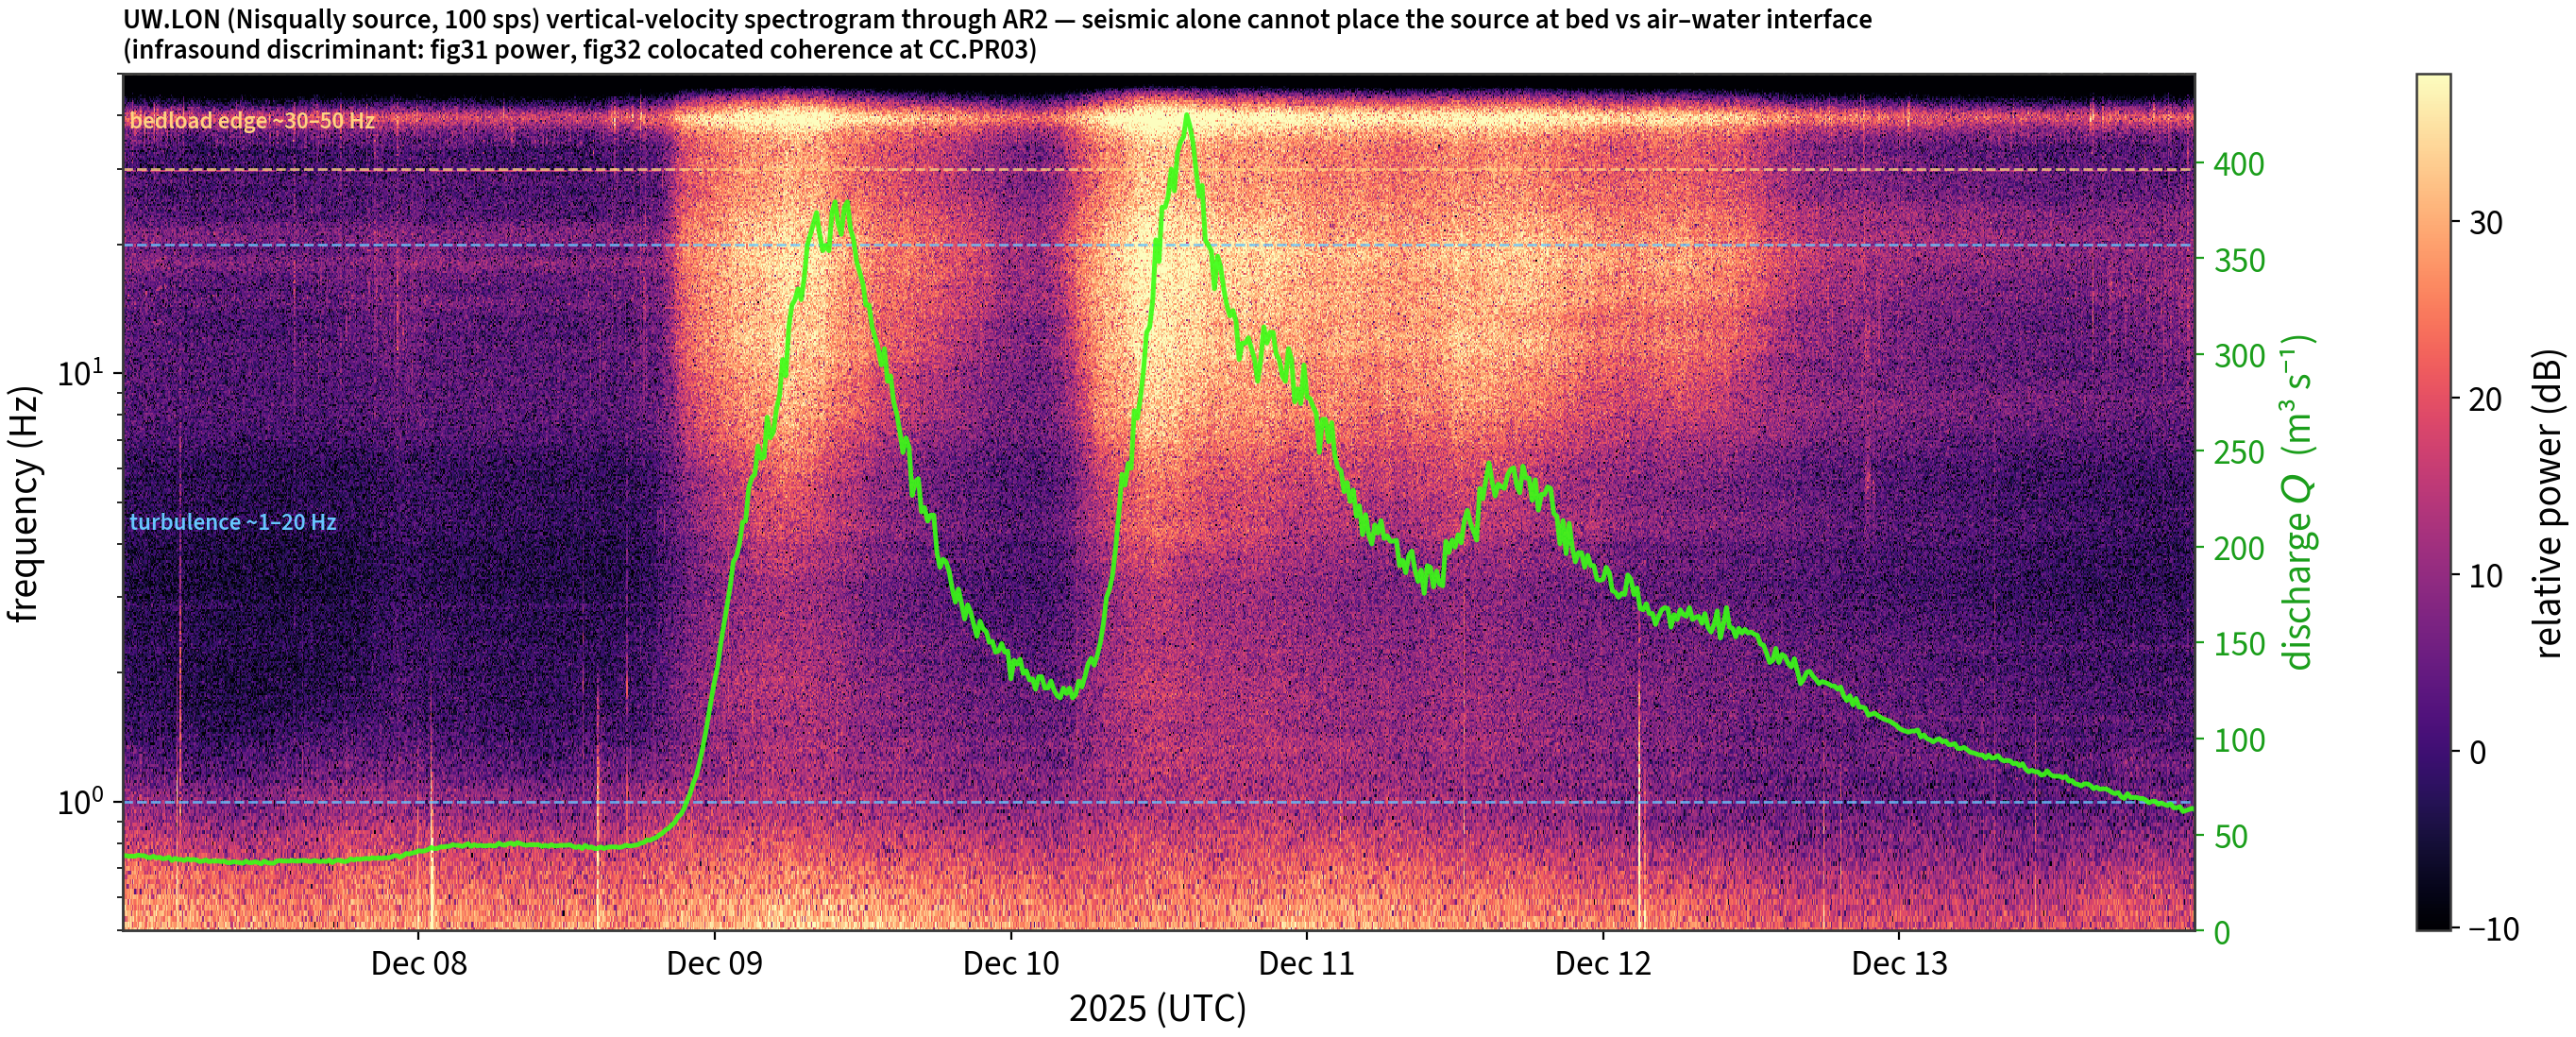
Spectrogram, and the colocated-infrasound discriminant. A single flood-vs-quiet spectrum (Figure 5.8) shows where in frequency the river signal sits; a continuous spectrogram (Figure 2.7) shows how that band structure evolves through the event — the view Schmandt et al. (2013) used in the Grand Canyon to assign different parts of the spectrum to different fluvial processes. At the 100-sps Nisqually source station UW.LON the seismic power across the turbulence band (~1–20 Hz) and the lower bedload edge (~30–50 Hz) rises and falls with the AR2 hydrograph, and the canonical clean-gravel bedload band (30–80 Hz) is only partly captured below the 50 Hz Nyquist — the same coverage limit discussed in the main text. Critically, the seismic record alone is spectrally degenerate: turbulent water flow over the bed and bedload impacts on the bed radiate into overlapping bands, so a bright band does not by itself locate the source — at the bed, or at the air–water interface. This is the central ambiguity behind treating our 1–15 Hz signal as turbulence-dominated and fine-gravel bedload as an upper bound (main text §sec-bedload). Colocated infrasound resolves it on physical grounds: bedload — grains striking the bed — radiates elastic waves into the ground (seismic) but couples poorly to the atmosphere, whereas free-surface turbulence (breaking waves, hydraulic jumps, splashing in rapids) at the air–water interface radiates strongly into the air (infrasound) and into air-coupled ground motion. The fraction of seismic power coherent with a colocated microbarometer is therefore attributable to surface/air–water sources, and the incoherent remainder is the candidate bed/in-water source (Schmandt et al., 2013).
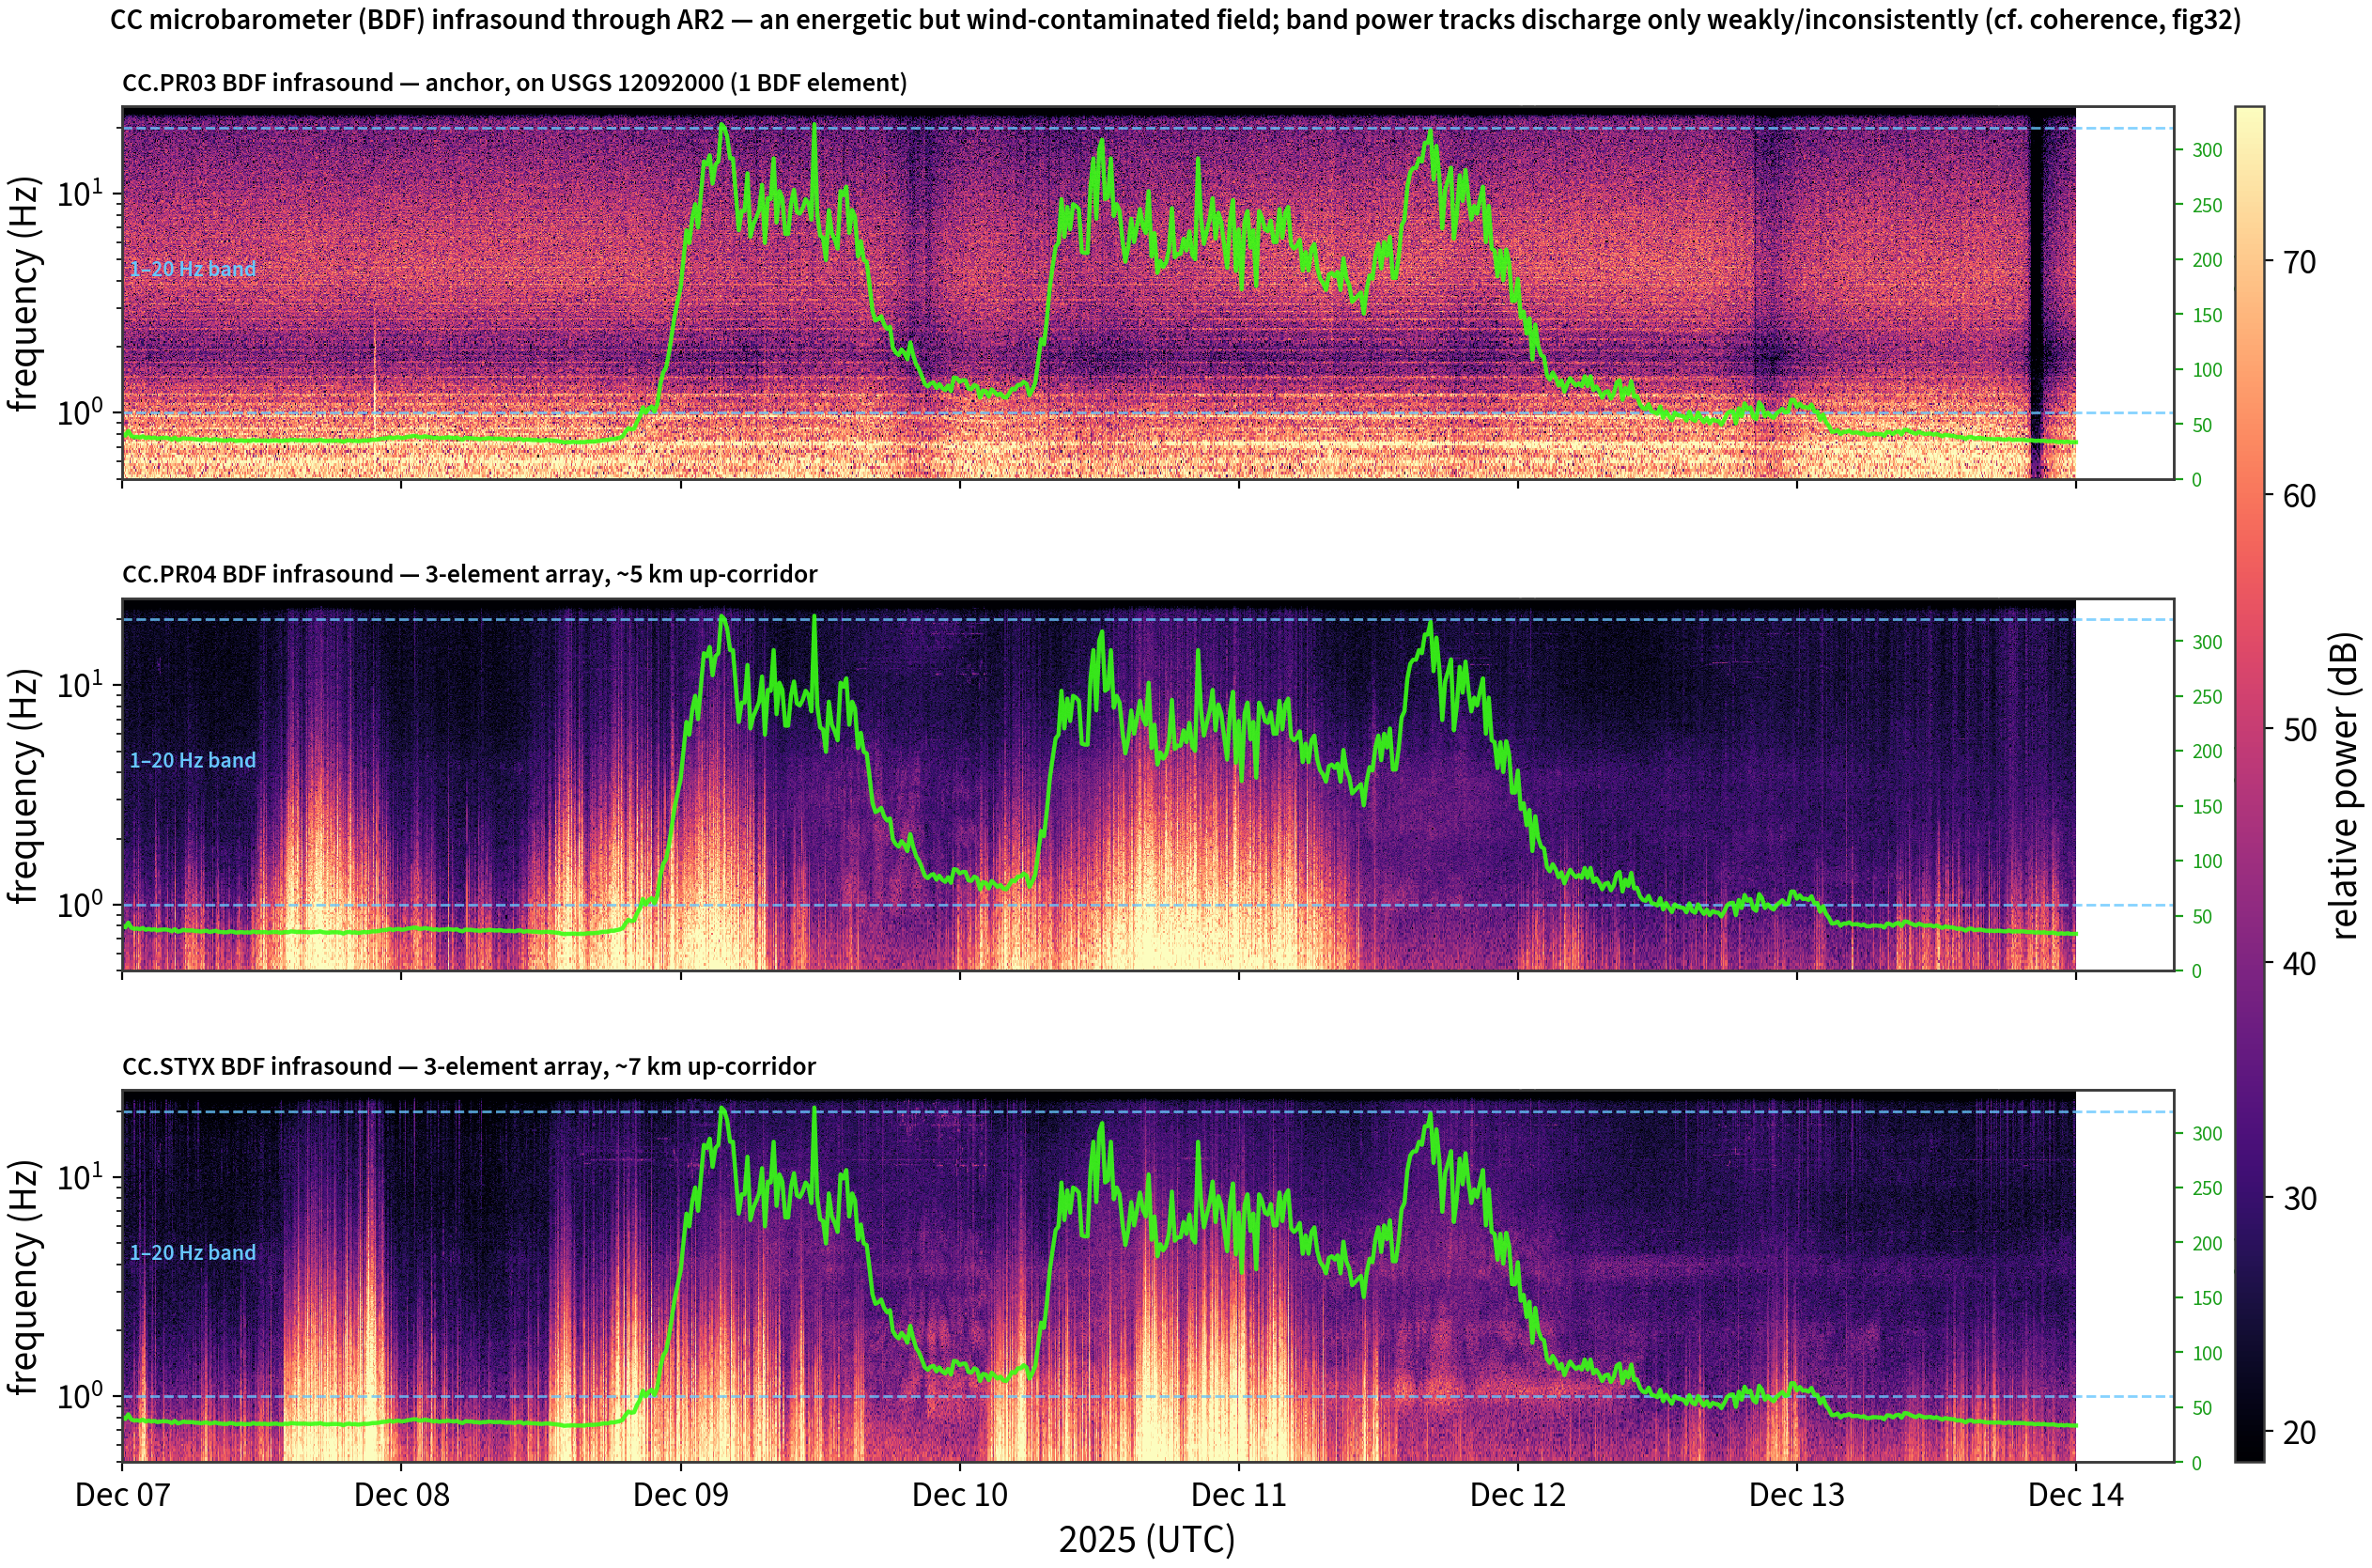
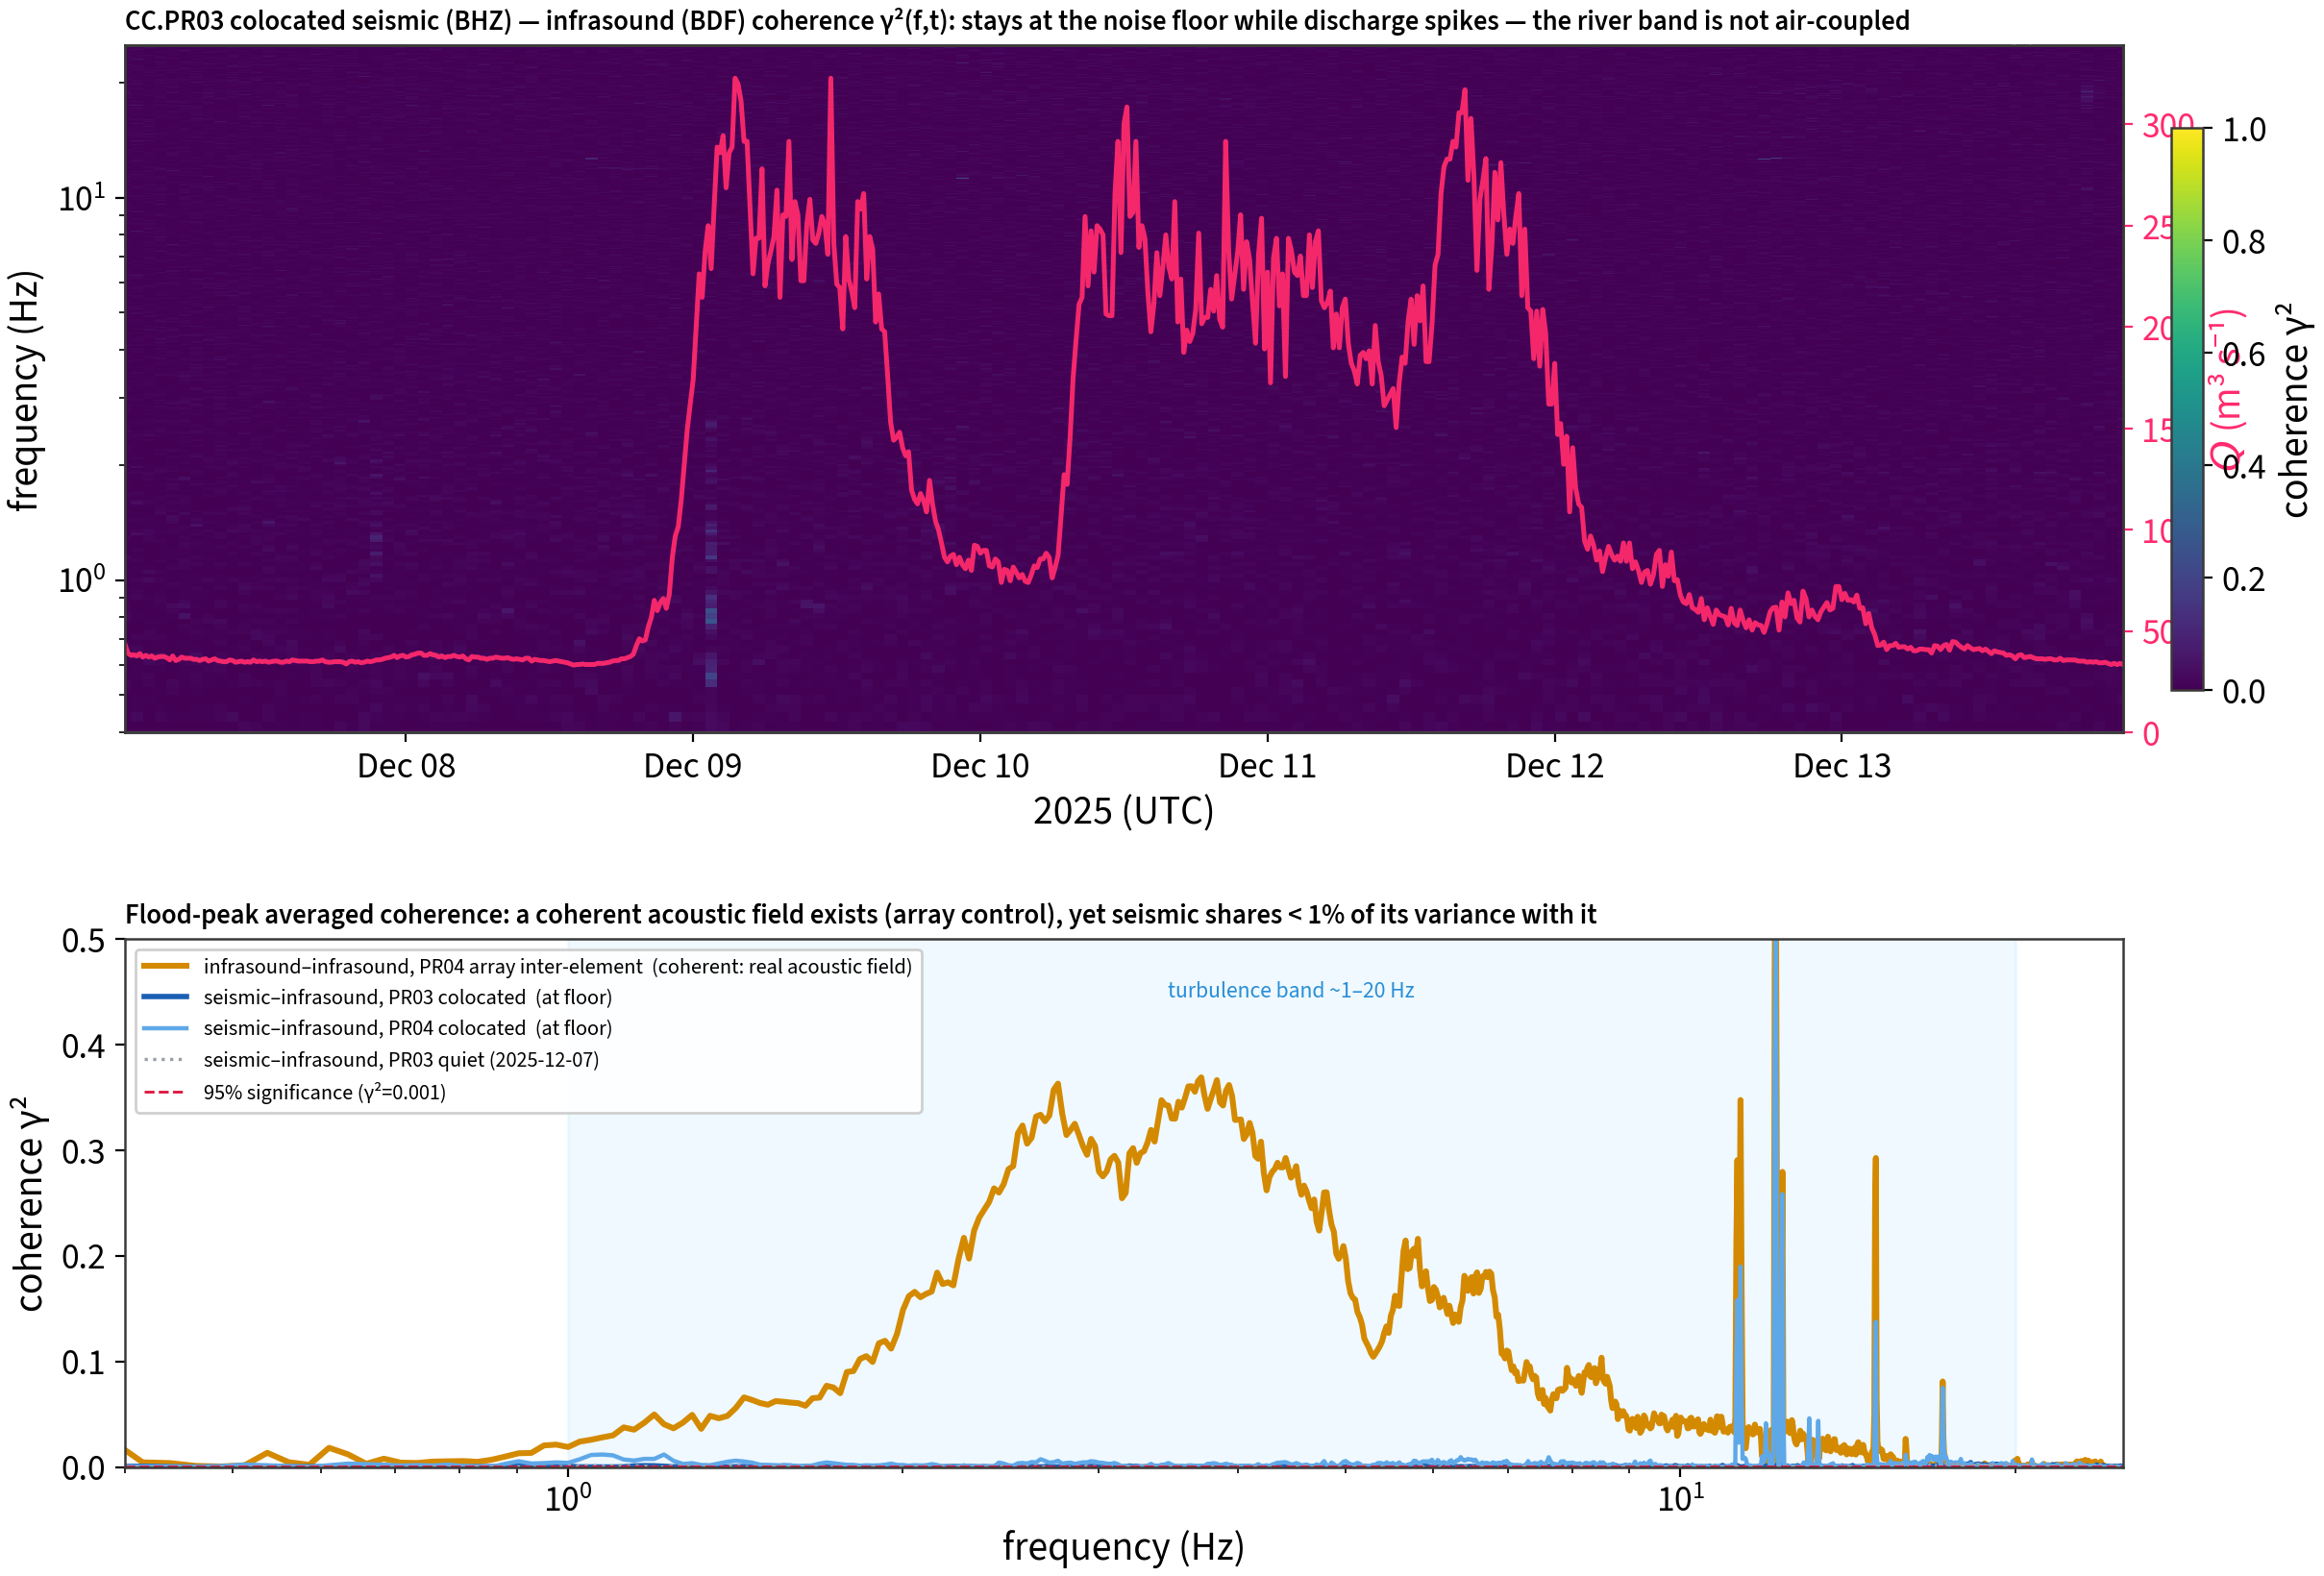
This network does carry infrasound, and we run the test. Contrary to the earlier framing that the Cascades stations had no microbarometer, the USGS Cascades Volcano Observatory (network CC) operates BDF infrasound arrays colocated with broadband seismometers along the upper-Puyallup lahar corridor — including at this study’s on-channel anchor CC.PR03, which sits on USGS gage 12092000 (Puyallup nr Electron) and carries colocated 50-sps seismic (BHZ) and 50-sps infrasound (BDF). We use the three stations with continuous BDF through AR2 — CC.PR03 (1 element), CC.PR04 and CC.STYX (3-element arrays, a few km up-corridor; CC.PR01/PR02 carried BDF only in 2018–2020). Figure 2.8 shows the infrasound is a genuine, energetic field but is heavily wind-contaminated, and its band-integrated 1–20 Hz power does not track discharge consistently (Spearman r from -0.36 at PR03 to +0.56 at STYX) — so raw infrasound power is not a clean flow proxy and the discriminant must be coherence, not power.
Figure 2.9 is that discriminant. Across AR2 the colocated seismic–infrasound coherence \gamma^2(f) stays at the noise floor (\gamma^2<0.01, < 1% shared variance) over 0.5–20 Hz at both CC.PR03 and CC.PR04, even at the discharge peak. This is not a dead sensor: as a positive control, two elements of the CC.PR04 infrasound array are mutually coherent (\gamma^2\approx0.2 at 2–8 Hz), so a real coherent acoustic field is present — the seismic river band simply is not phase-locked to it. The colocated infrasound therefore bounds the air-coupled fraction of the seismic river signal as small, supporting a dominantly ground-radiated (bed / in-water-turbulence) origin over coherent air–water-interface radiation — consistent with treating the 1–15 Hz signal as turbulence-over-the-bed (Gimbert et al., 2014) with bedload as an upper bound (main text §sec-bedload). The bound is one-sided: spatially-incoherent free-surface turbulence and wind contamination also lower point coherence, so the result constrains rather than excludes a surface contribution. The canonical bedload band (30–80 Hz) lies above the 25 Hz sampling Nyquist of the 50-sps microbarometers, so it is simply not recorded here — an instrumental limit, not a statement about acoustic coupling.
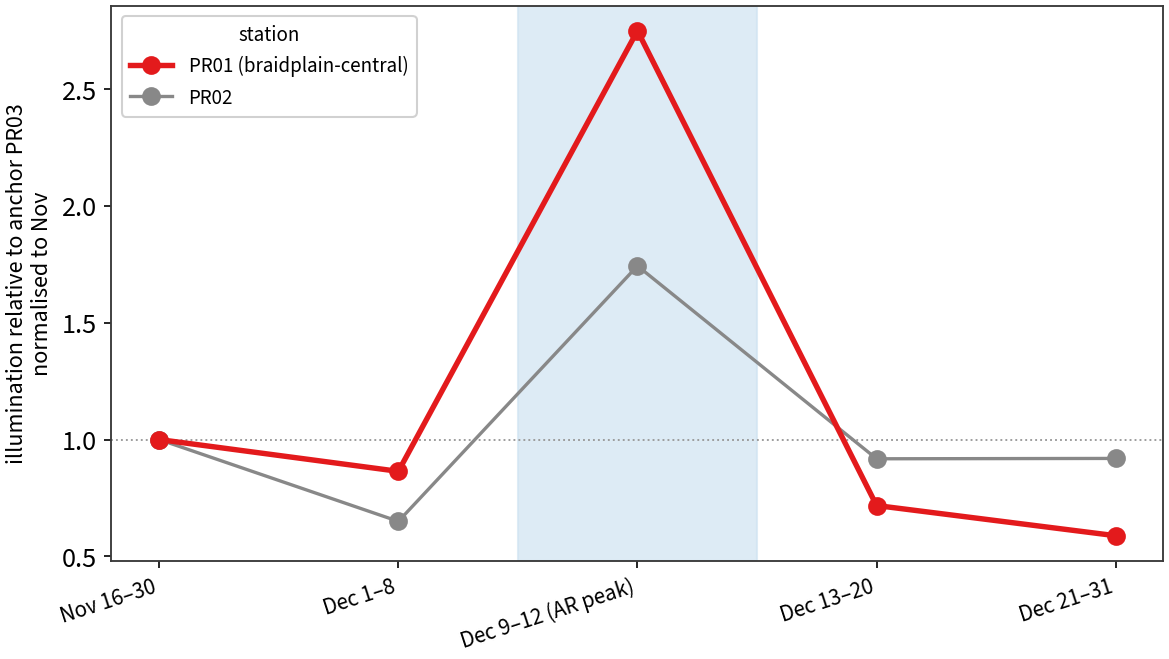
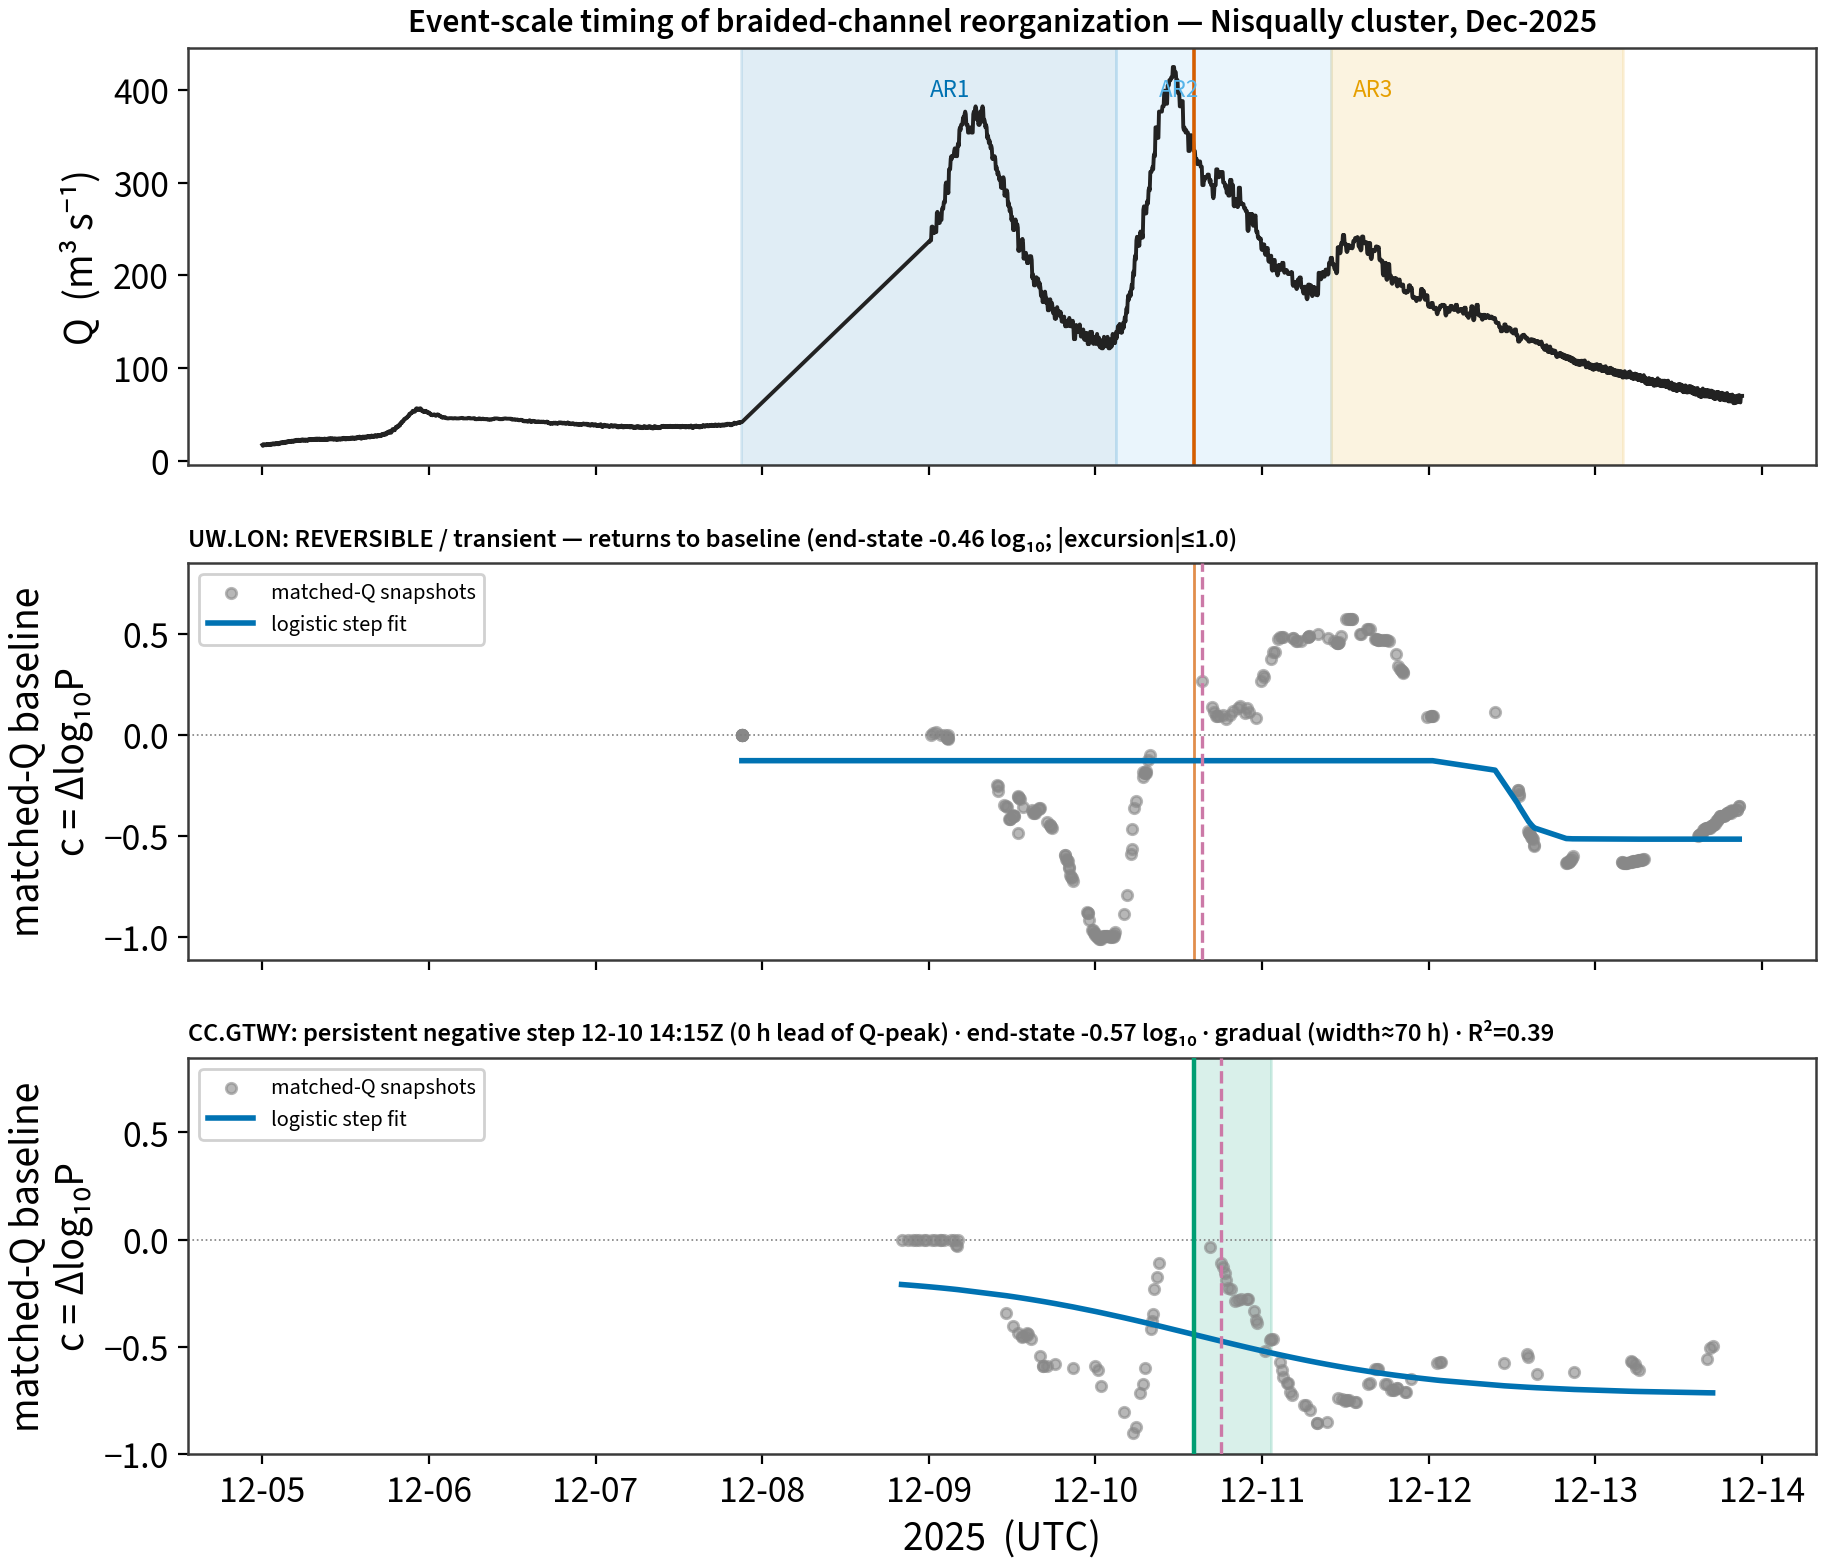
workflows/21_braided_reorg_timing.py --basin nisqually.)
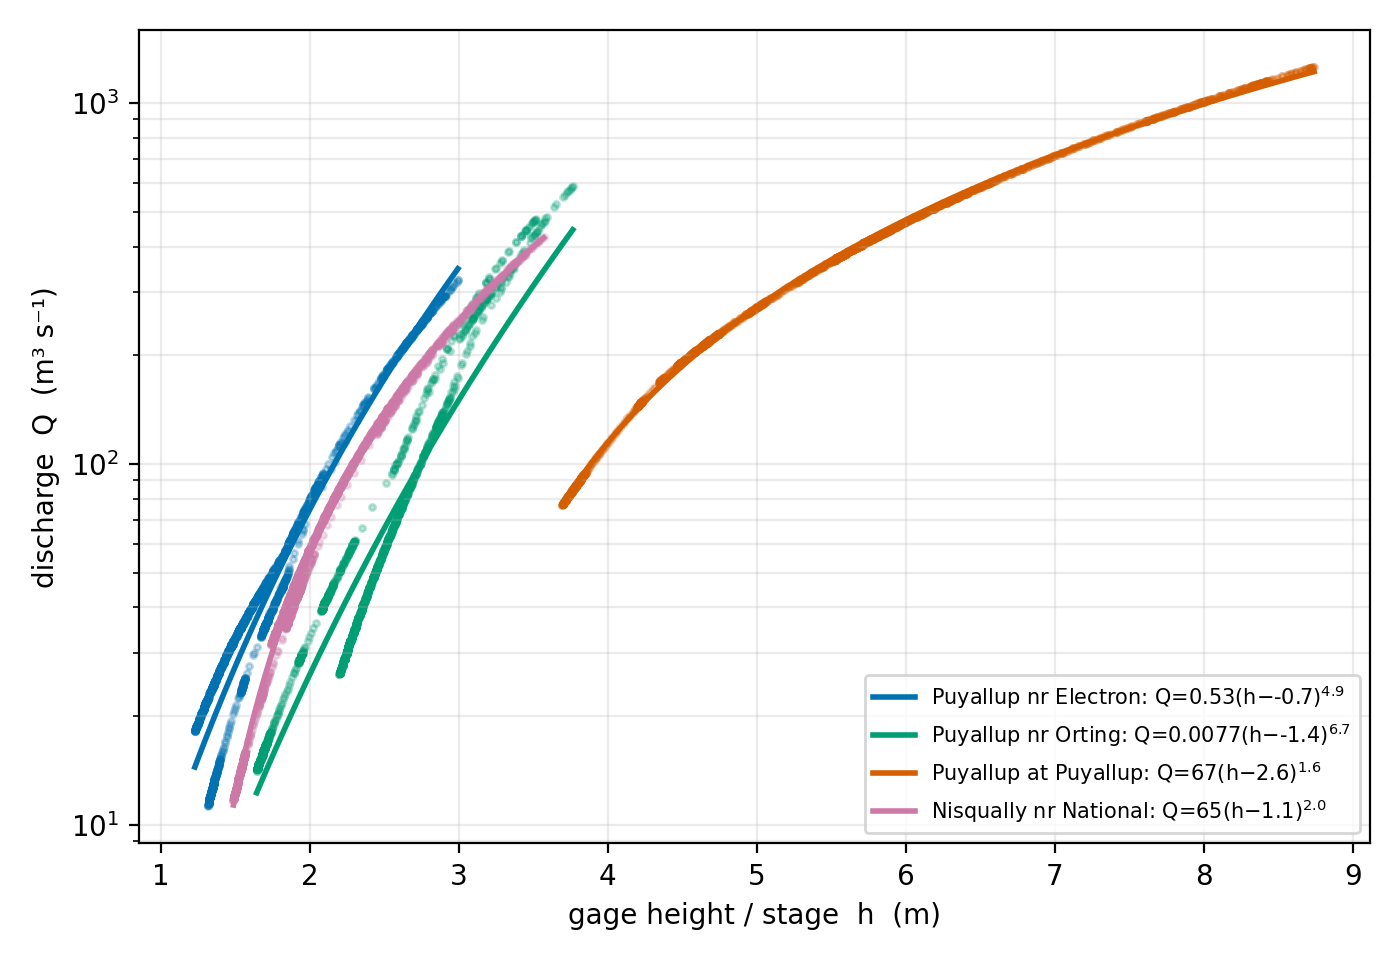
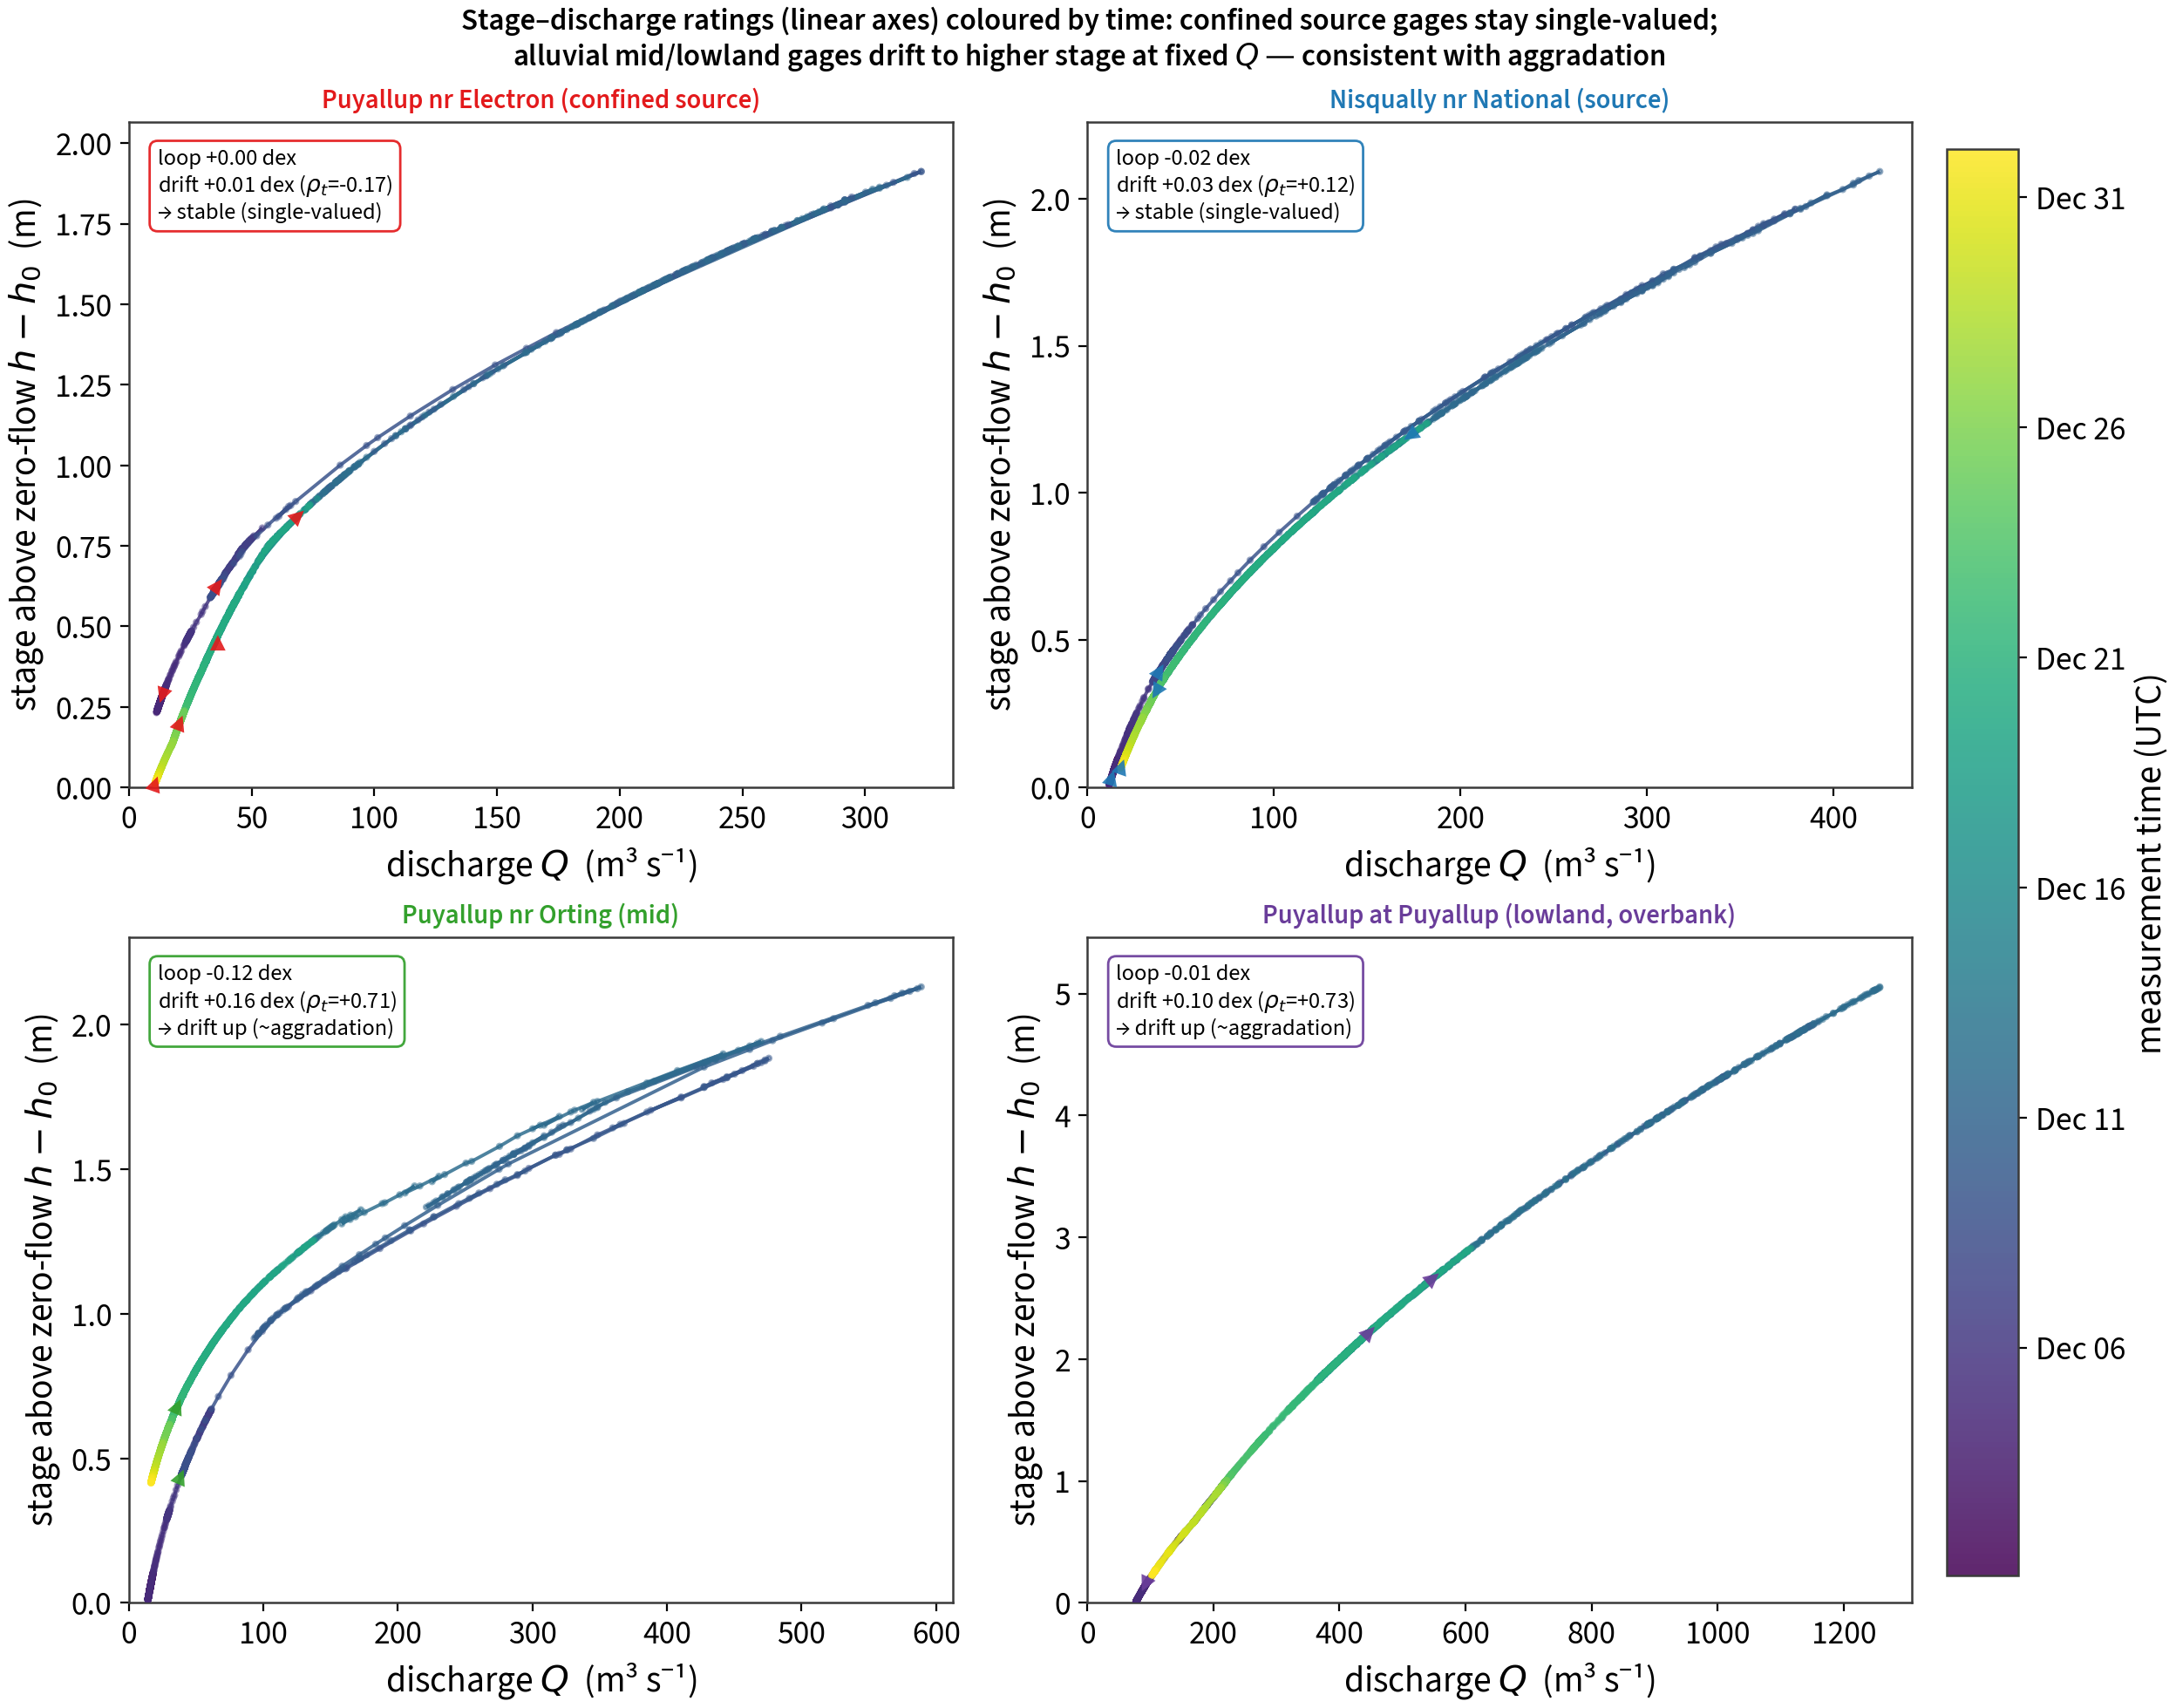
Stage–discharge hysteresis and what it can (and cannot) say about aggradation. A linear stage–discharge view (Figure 2.13) makes the non-stationarity of the gage ratings legible. Two physically distinct effects open a single-valued rating into a loop, and only one is even a candidate bed-change diagnostic. (i) Within-event loops (the rising limb tracing a different curve from the falling limb at the same Q) are dominantly an unsteady-flow / looped-rating (Jones) effect: the flood-wave water-surface slope is steeper while the wave is rising, so a given stage conveys more discharge (equivalently, lower stage at a given Q on the rising limb). Because a sediment scour-and-fill cycle produces a loop of the same sense, the within-event loop direction by itself cannot distinguish bed scour from deposition (Jones, 1916). (ii) The candidate bed signal is instead the net drift of the rating through the AR sequence: a sustained rise in stage at a fixed discharge means the channel now conveys the same flow at a higher water level. We quantify both per gage at elevated flow (Q> median): the within-event loop amplitude (rising−falling stage residual about the mean rating, in \log_{10} units, “dex”) and the net cross-event drift (late−early median shift, and the Spearman \rho of the stage residual with time). The confined source gages (Puyallup nr Electron, Nisqually nr National) are essentially single-valued (\rho\approx0, drift \lesssim 0.03 dex) — stable hydraulic controls (a fixed coarse, confined control section). The unconfined mid Puyallup-nr-Orting and lowland Puyallup-at-Puyallup gages instead drift monotonically to higher stage at fixed Q through December (\rho\approx0.7; +0.16 and +0.10 dex, i.e. $$25–45 % higher stage at matched discharge by month’s end).
We read this drift as most simply explained by net aggradation (deposition raising the bed/control section) in these depositional reaches — but stage–discharge data alone cannot prove it: a rating shift of this sense is also produced by increased hydraulic roughness, by changing downstream backwater (bar growth, large-wood or debris jams), by control-section reorganization that is not net bed-raising, or by USGS rating-shift artifacts (Walling, 1977), and a seismic/turbidity proxy can likewise confound a boundary-roughness change with a transport change (Roth et al., 2016, 2017). A strict aggradation claim requires consistency with a sediment-flux divergence (the Exner balance) and independent bed-elevation evidence, which a point gage does not provide. What lends the aggradation reading weight here is its convergence with independent observations in the same reaches — the satellite active-channel change and thread-migration drift (§sec-braided, §sec-reorg; the +0.2 cross-AR seismic baseline drift) and the documented Holocene-to-modern aggradational, supply-rich sediment regime of the lower Puyallup and Rainier’s proglacial basins (Anderson, 2026; Anderson & Shean, 2022; Czuba et al., 2011). The hysteresis is thus the time-domain counterpart of the reach-geometry-dependent, event-specific ratings documented for the braided reaches, and reinforces that a virtual-discharge-to-stage mapping inherits the same event-specific caveat.
Ground truth from repeat lidar. A watershed-scale sediment budget built from 2002–2022 aerial-lidar differencing (Anderson, 2025, 2026) both supports and sharpens this reading. It confirms that the lowland Puyallup (the lower $$20 valley miles, spanning the Puyallup-at-Puyallup gage) is genuinely aggrading — $1.010^6$ m³ of sand-and-gravel deposition over 2004–2020 ($$60{,}000 m³ yr⁻¹, continuing a trend back to at least the 1970s) — and attributes it to a downstream decrease in channel slope driving a sediment-flux divergence (the Exner condition) under an abundant coarse supply. Our lowland rating drift is thus consistent with an independently documented, ongoing aggradational phase. The same budget, however, finds the upper reaches (near Orting and Electron — our confined source gages) to be net sediment sources whose long-term (60–100 yr) stage–discharge relations show incision or no trend, and it revises an earlier, larger 1984–2009 upper-reach aggradation estimate downward as a survey-extent artifact. We therefore read the drift at the upper Puyallup-nr-Orting gage as a transient, within-event rating shift (scour/fill, roughness, backwater), not long-term aggradation, and confine the aggradation interpretation to the lowland reach where the lidar record independently supports it. Notably, Anderson (2026)’s own bedload proxy — an empirical bedload–discharge power law applied to these same gages — rises $$40 % in transport capacity over 2004–2020 yet is explicitly cast as capacity, not deposition; that capacity-vs-delivered-load distinction bounds our seismic proxy in exactly the same way.
Supplementary animations. Two animations accompany the HTML edition: the space–time virtual-discharge field (Figure 5.9) and a repository-only multidisciplinary loop (SNOTEL + gage + bedload power) at paper/figures/bedload_animation.gif.