3 Story roadmap — seis-hydro-2-sed
Strategic inventory of every research thread we have explored on the December-2025 Mt. Rainier atmospheric-river floods, the evidence and assumptions behind each, and the figure(s) attached. Purpose: see all options on one page, then choose the single main story for the paper. This is a planning document, not the manuscript.
Last updated: 2026-06-22.
This page exists so we can choose one spine for the paper from everything the project currently supports. We are not short of results — we have ~18 figures across a dozen distinct lines of evidence — so the risk is a diffuse paper that does many things adequately and none decisively. The list below is deliberately flat and even-handed: each thread gets the same treatment regardless of how much we like it, so the comparison is honest.
How each thread is scored. Every thread carries five fields:
- Claim — the one sentence we would have to defend in review.
- Evidence (figs) — the specific figures that back it (labels match the manuscript exactly; see the inventory table).
- Key assumptions — what must be true for the claim to hold. This is where most threads are vulnerable; read these as the reviewer’s first line of attack.
- Strength — a blunt editorial judgment (foundational / strong / medium / weak), not a statistical statement. “Strong” means novel + well-supported + hard to refute; “weak” means the data underdetermine the claim even if it is plausible.
- What would close the gap — the single most decisive missing piece. Several of these point at the same three pending inputs (see open dependencies at the end).
How threads relate. They are not independent. T1 (scaling) underpins everything. T4 (frequency rigor) and T9 (braided source) are constraints that bound or reinterpret the more ambitious threads (T3 bedload, T5 threshold, T7 virtual gage) — treating them as caveats rather than separate papers is deliberate. T10 (the event) is the container the rest hang from. The “candidate main stories” section at the end recombines the threads three ways and argues for one.
What this document is not. It is not the manuscript and not a literature review (those are the Manuscript and Reviews parts of this book). Strength labels are provisional and will move as the three open dependencies resolve.
3.1 Figure inventory (label → file → one-line content)
(Click any figure name to open it.)
| Label | Figure (click to view) | Content |
|---|---|---|
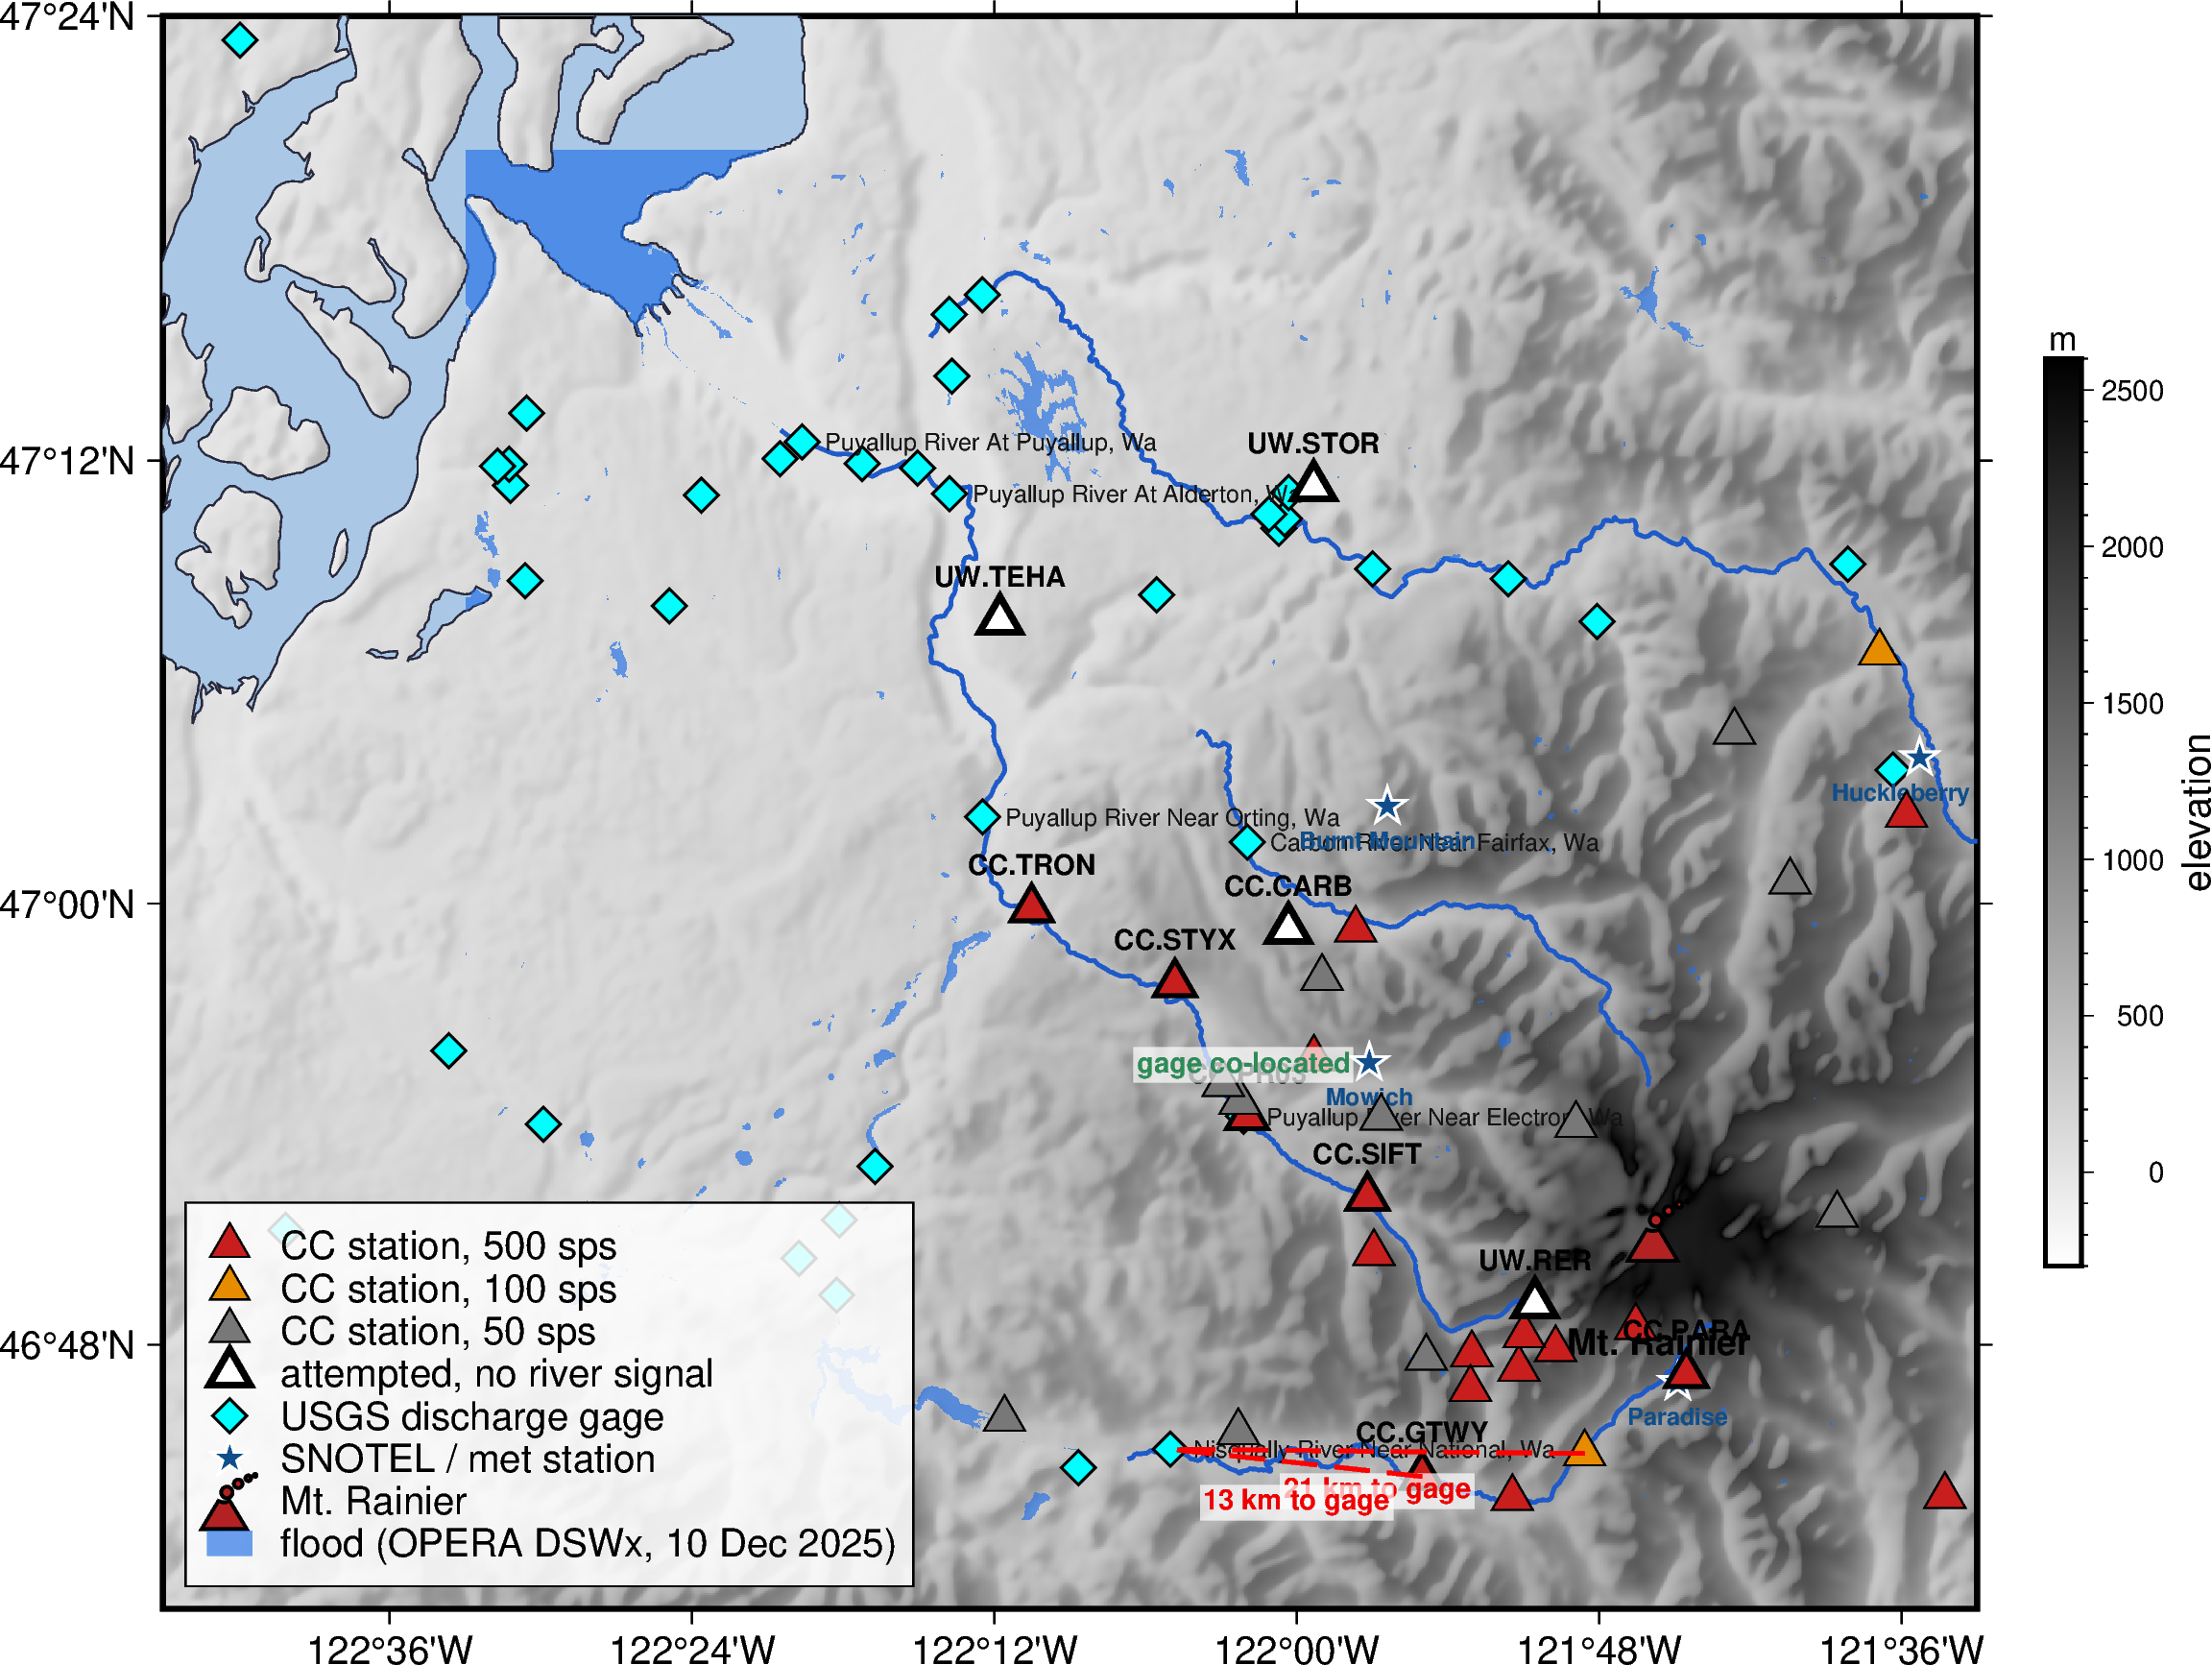
@fig-map |
fig1_transect_map.png | PyGMT transect: DEM, NHD rivers, gages (diamonds), SNOTEL, OPERA flood, station status (hollow = no signal) |
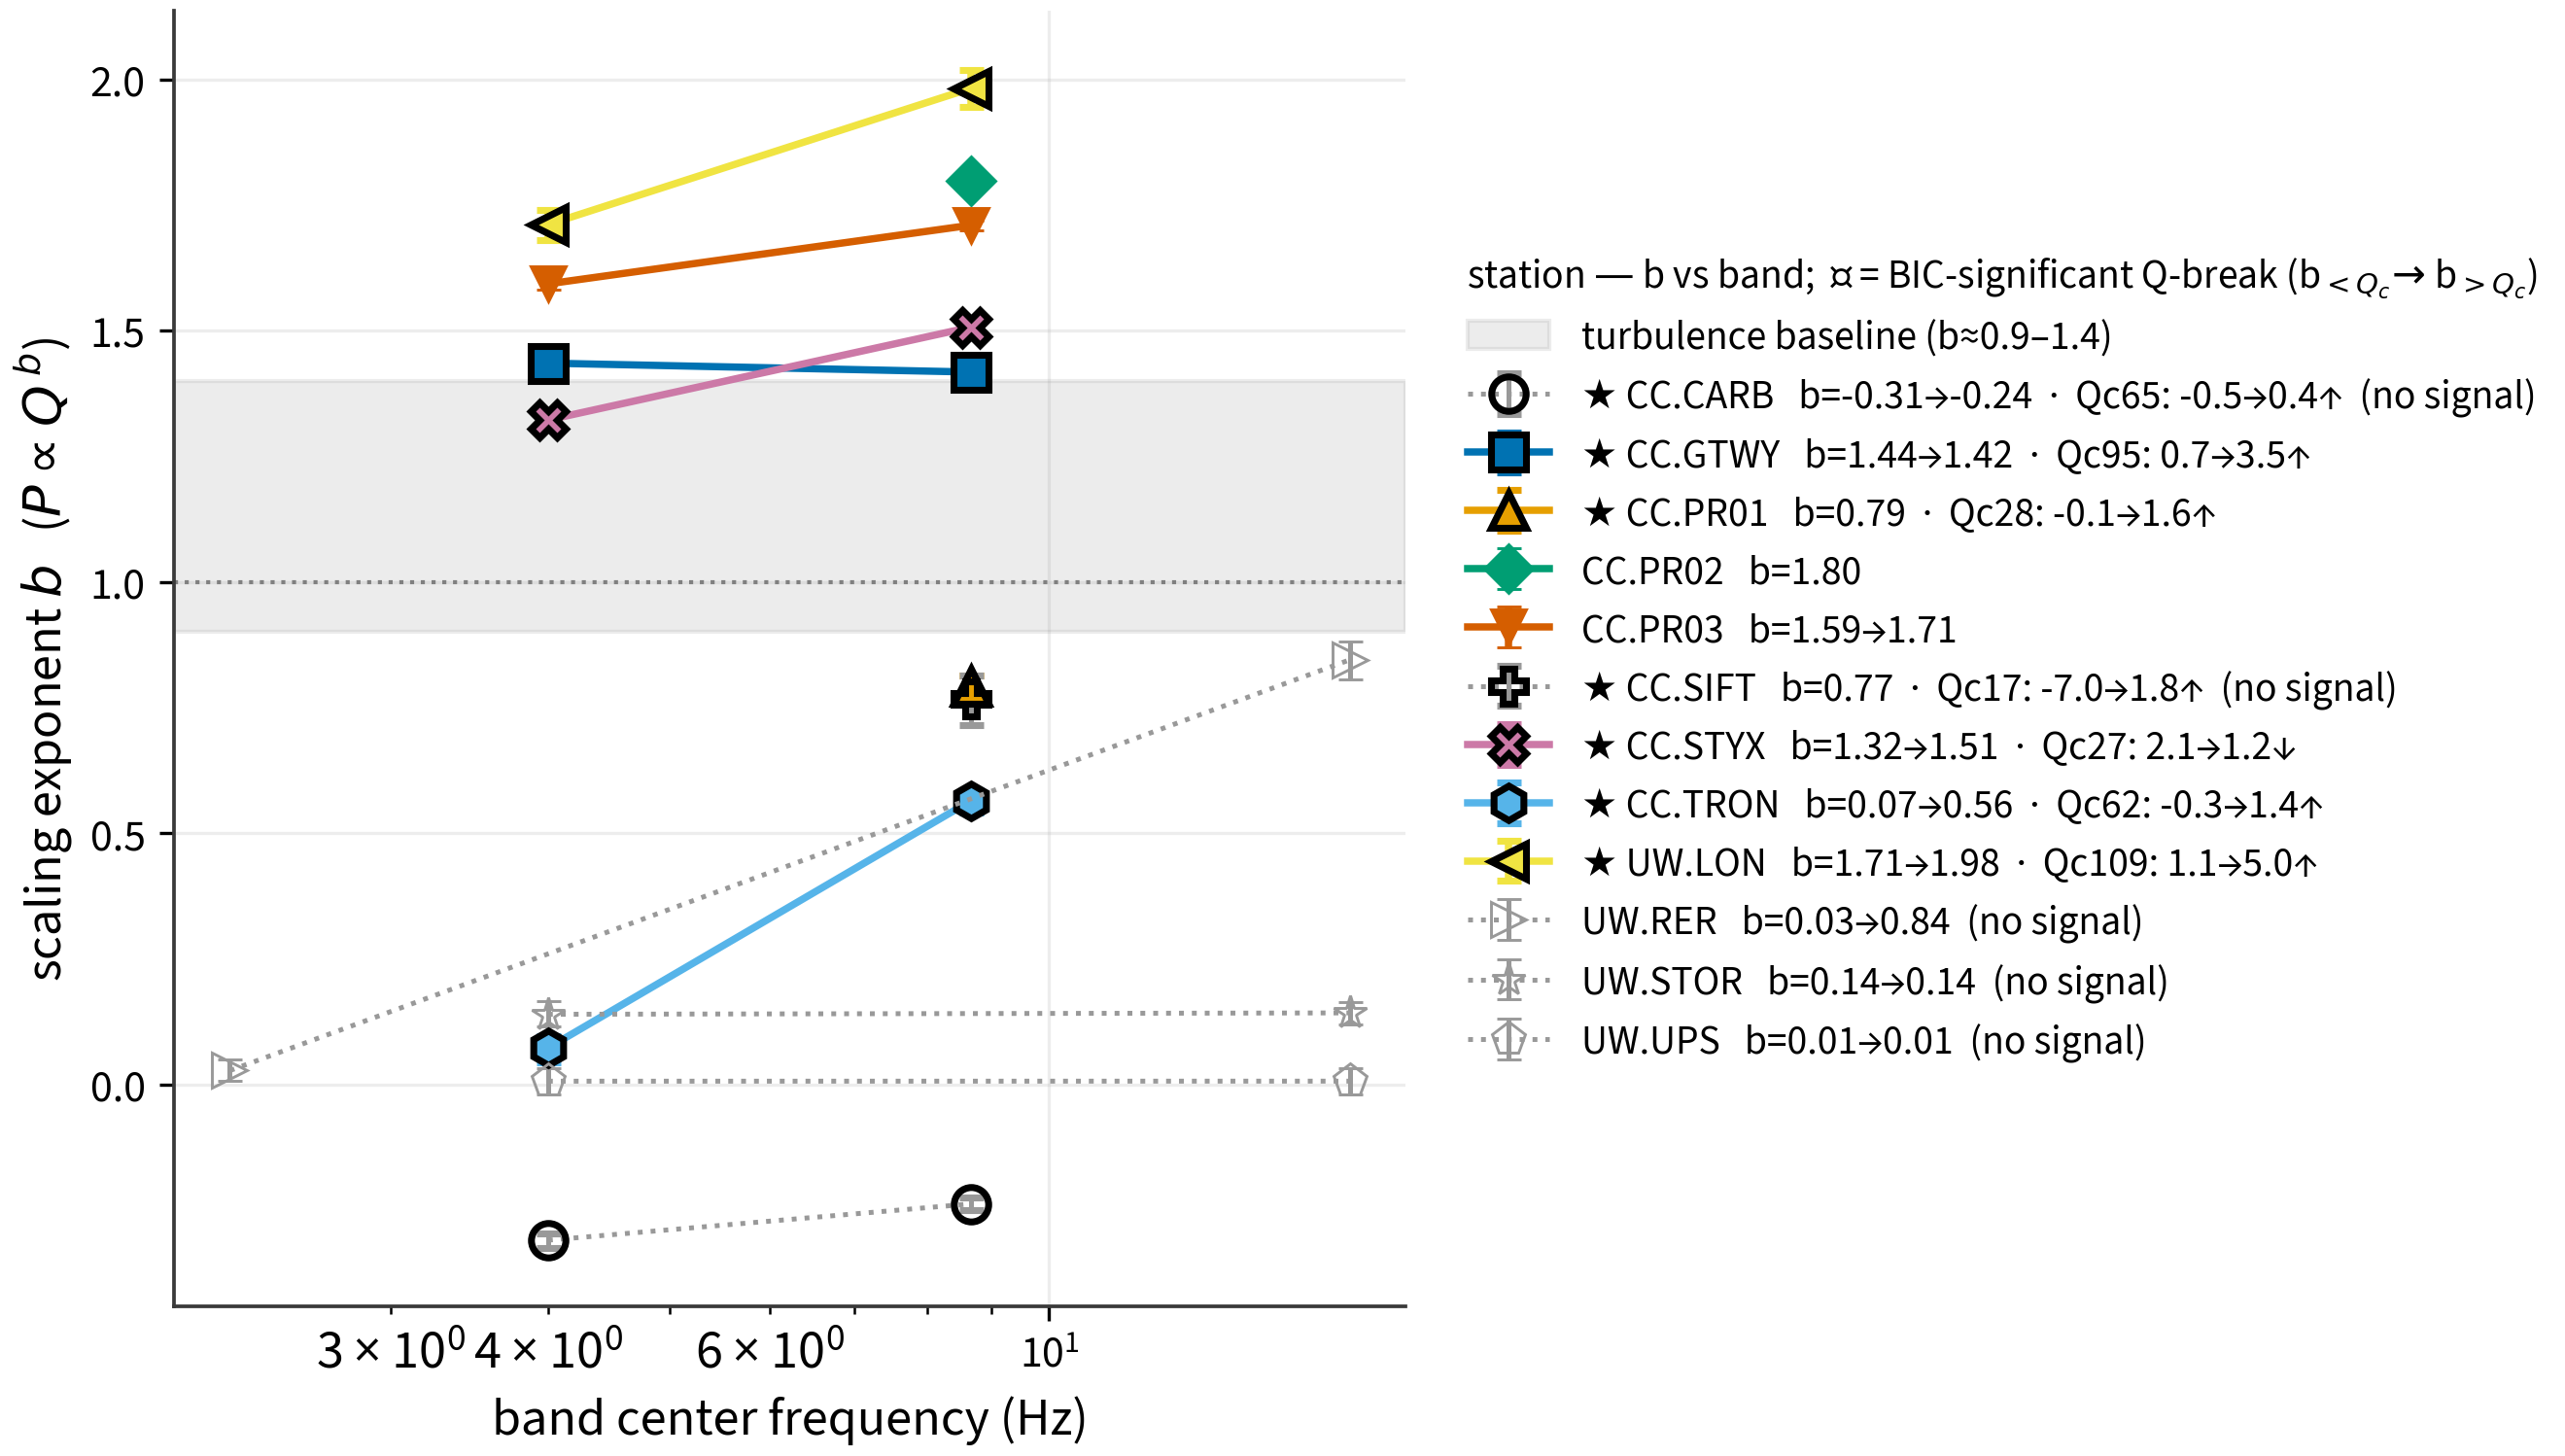
@fig-scaling |
fig2_scaling_exponent.png | Scaling exponent b per station, source→downstream; no-signal hollow/grey |
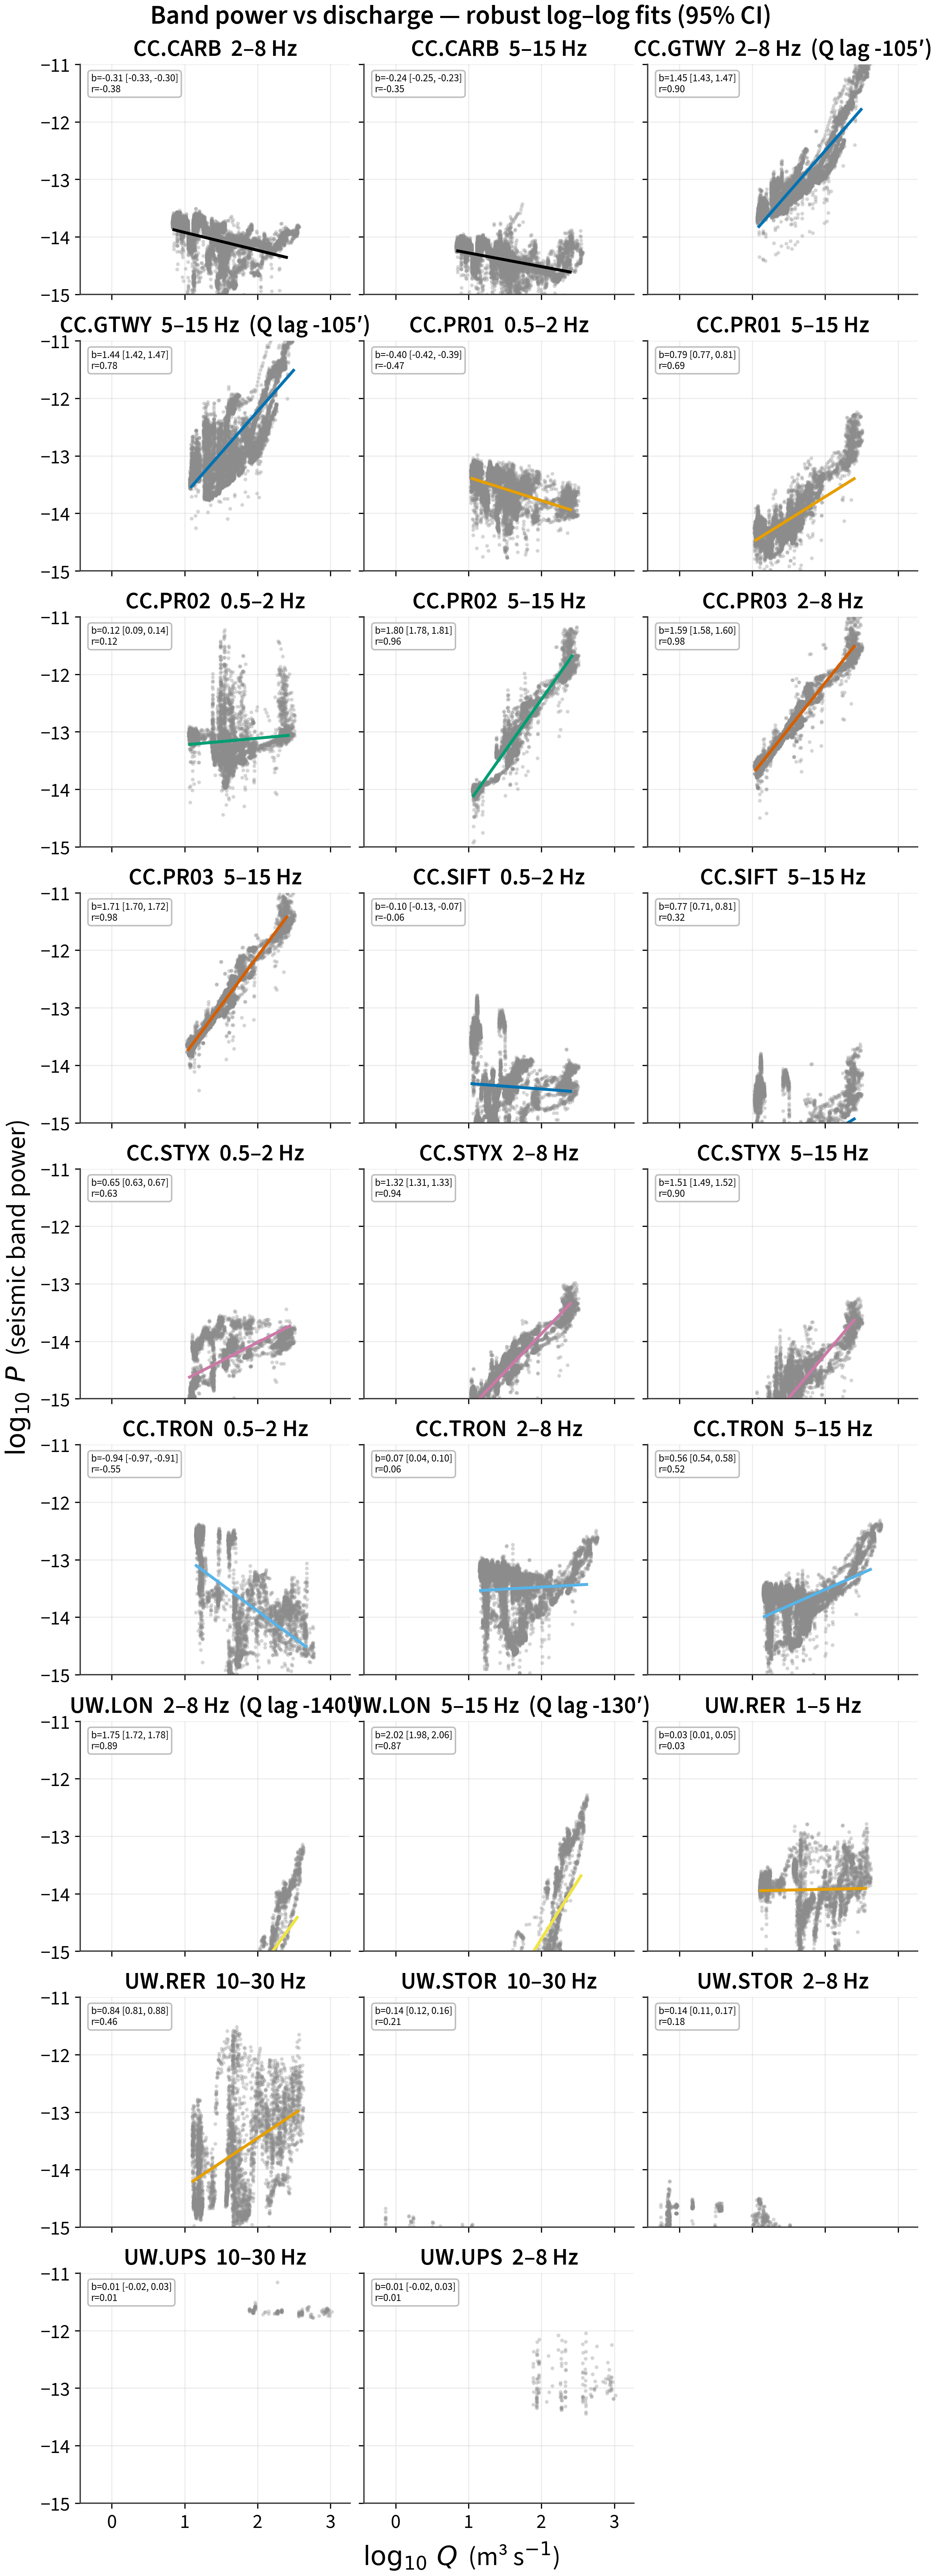
@fig-scatter |
fig3_pq_scatter.png | log P vs log Q scatter + power-law fits |
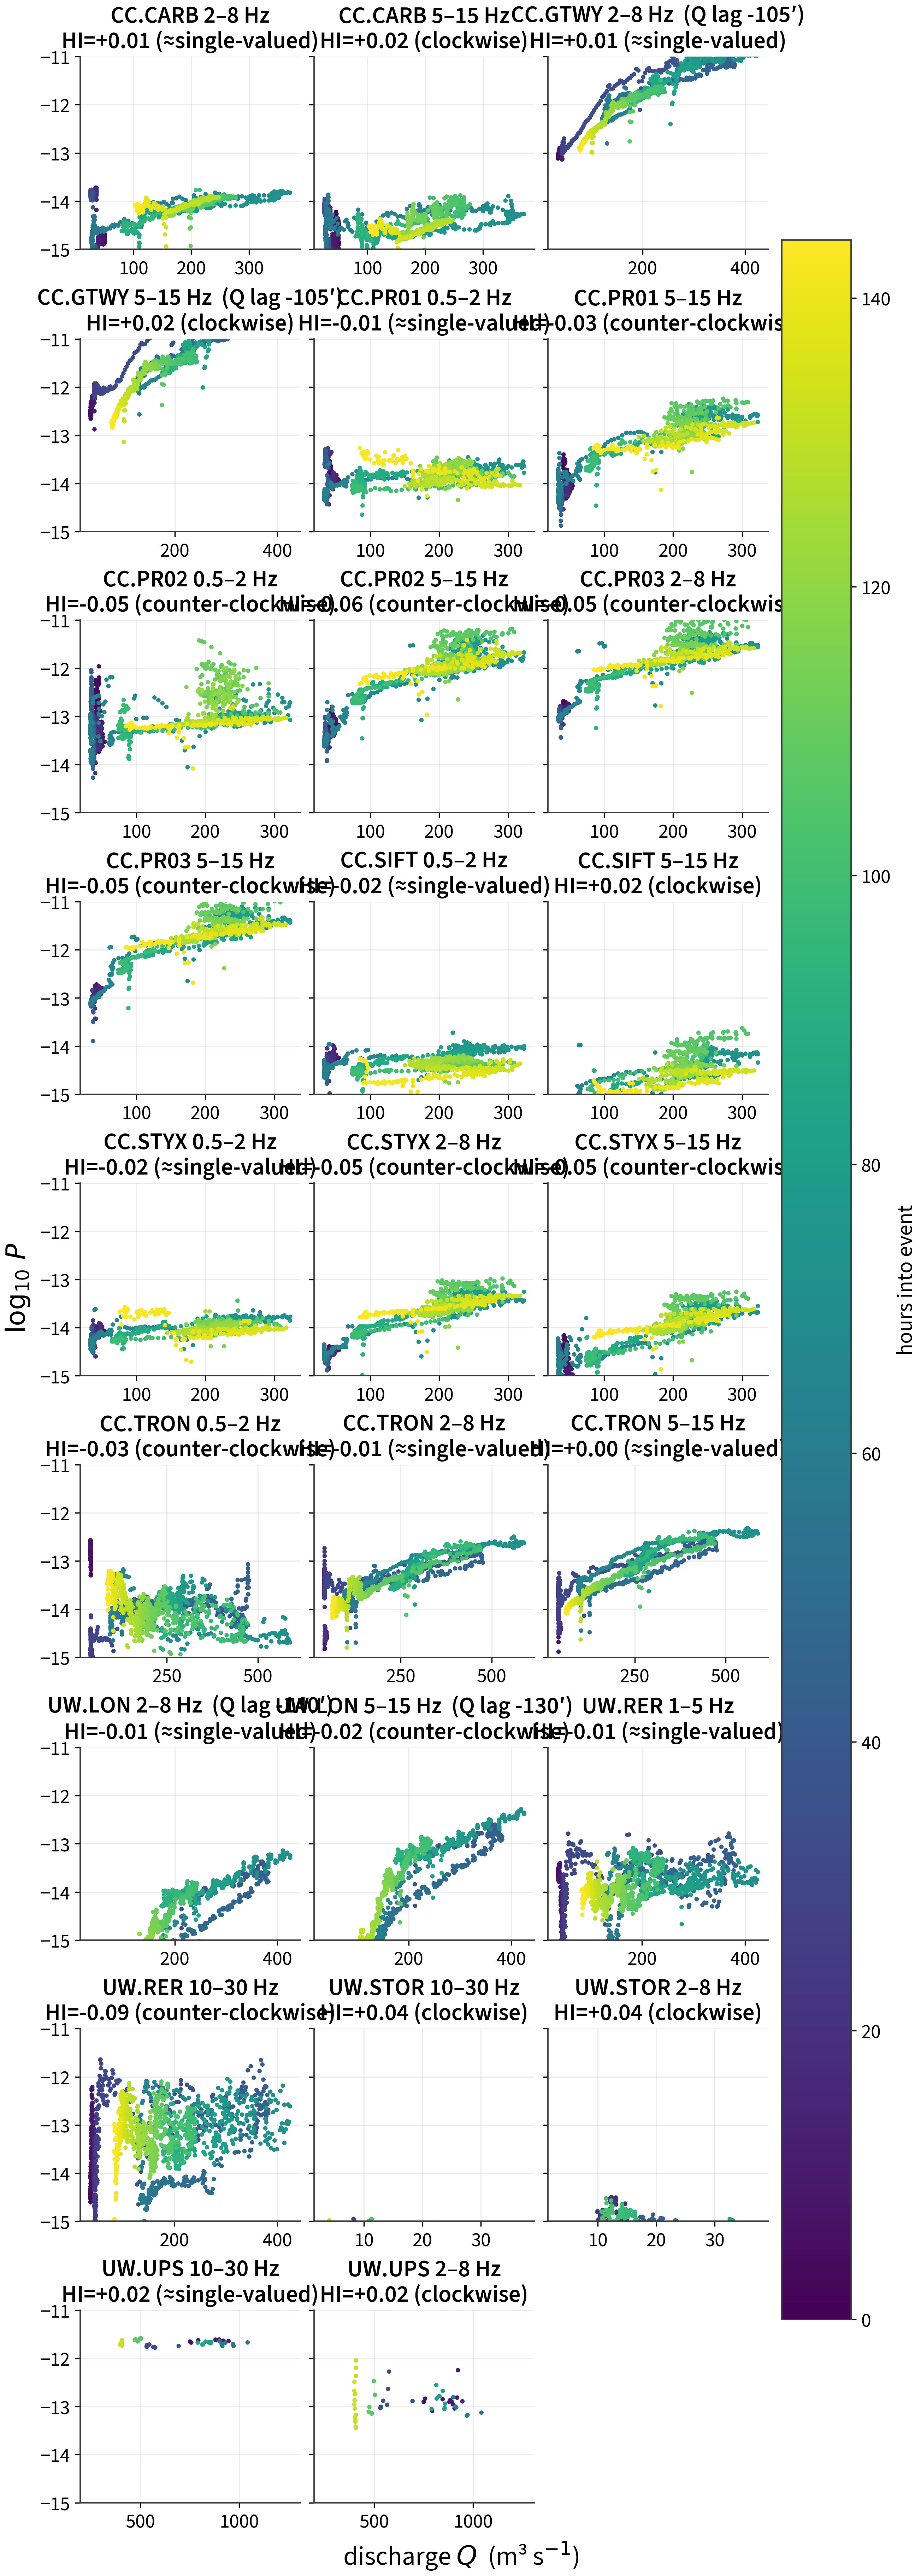
@fig-hyst |
fig4_hysteresis.png | Per-event P–Q hysteresis loops |
@fig-ts |
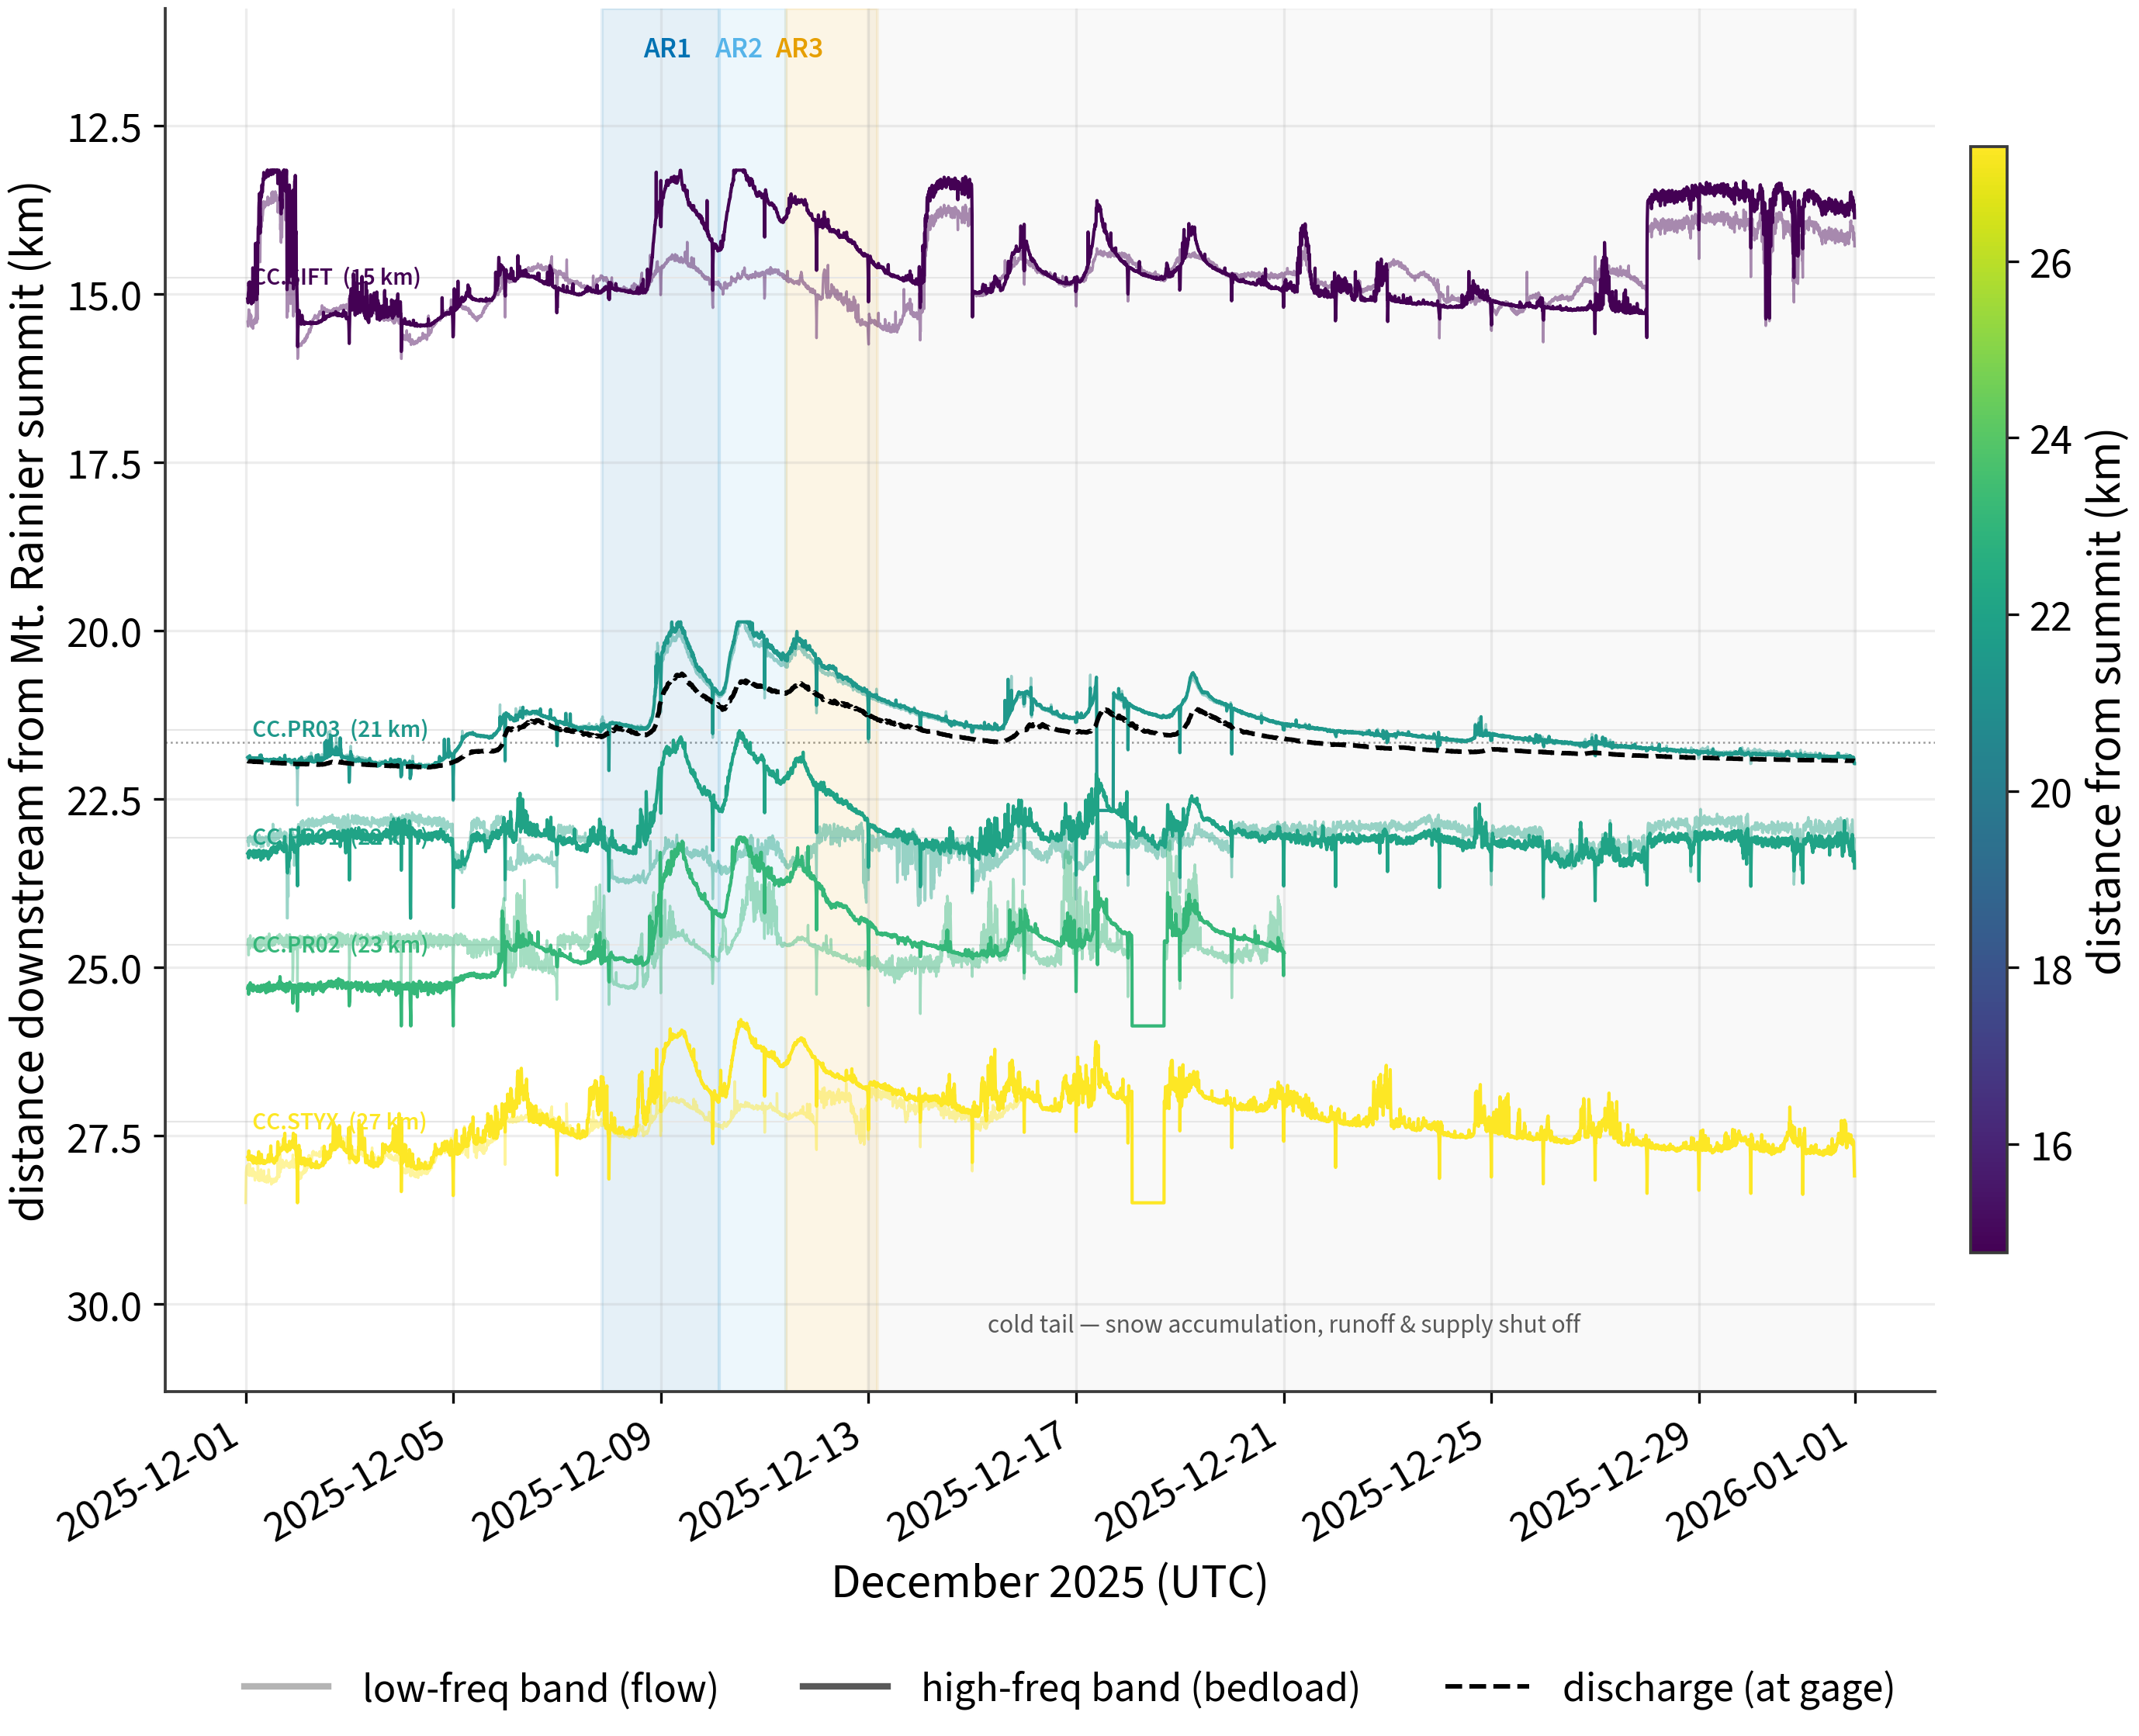
fig5_event_timeseries.png | Ridgeline event timeseries, ordered by distance downstream |
@fig-bltime |
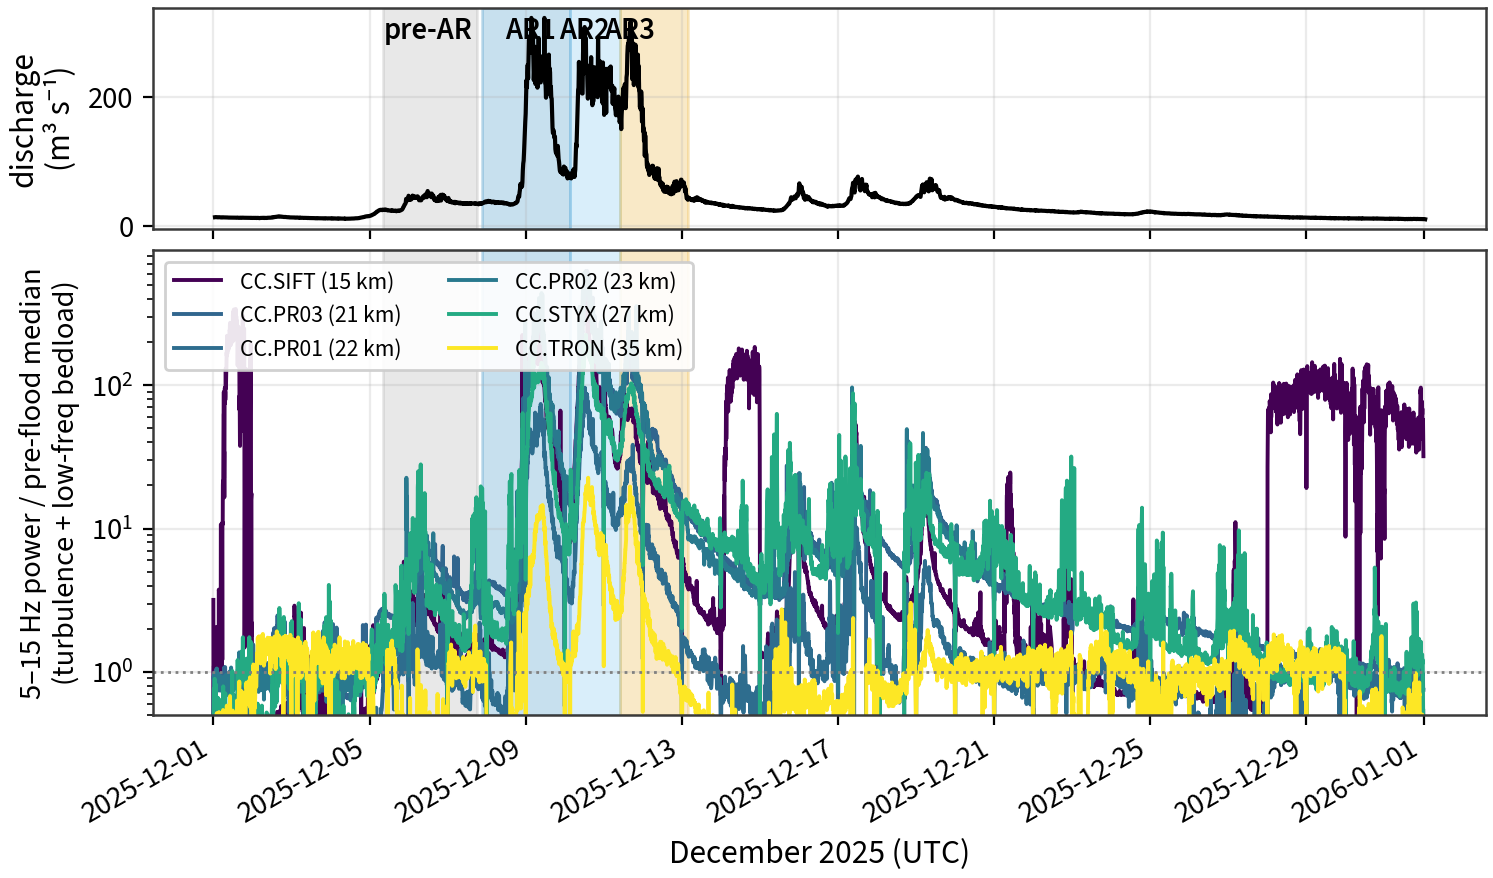
fig6_bedload_time.png | 5–15 Hz “bedload” power ×pre-flood median through the ARs |
@fig-bl |
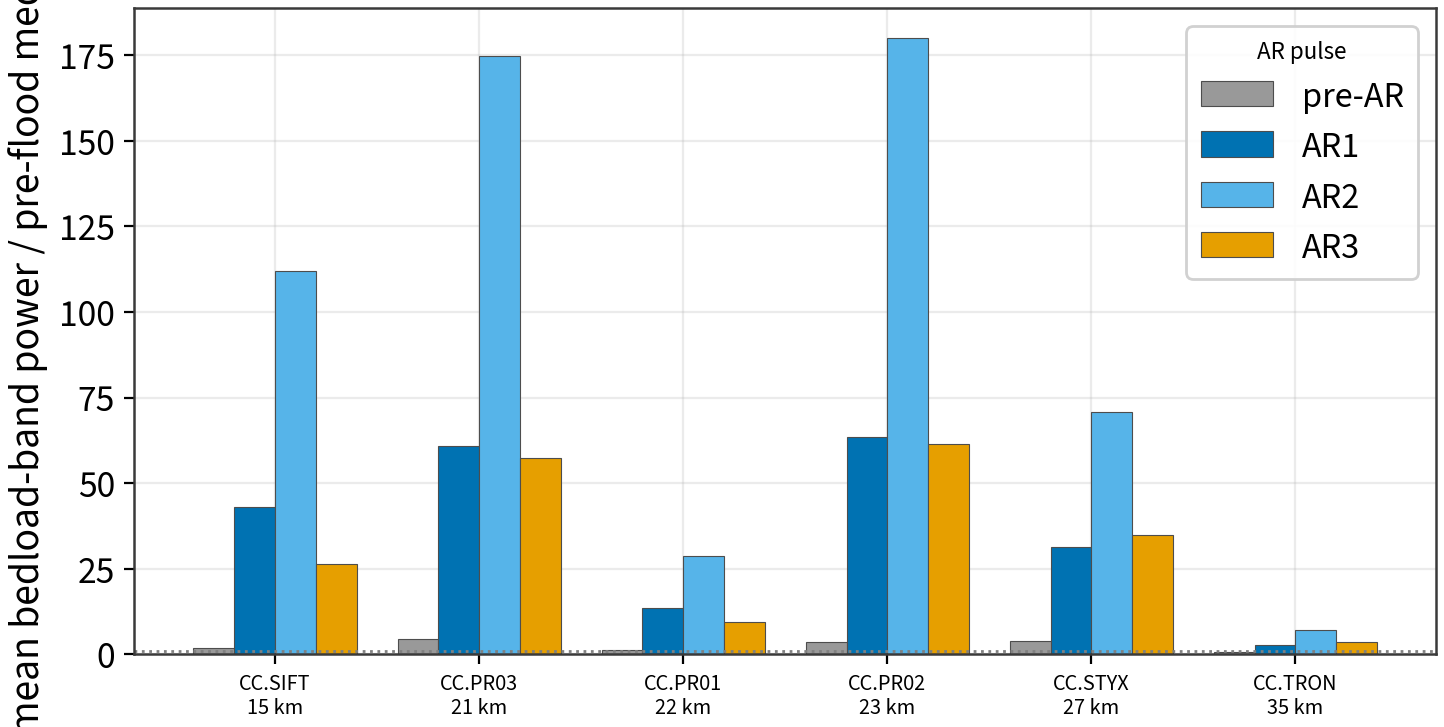
fig7_bedload_per_AR.png | Per-AR average bedload by station (AR2 dominates) |
@fig-bt |
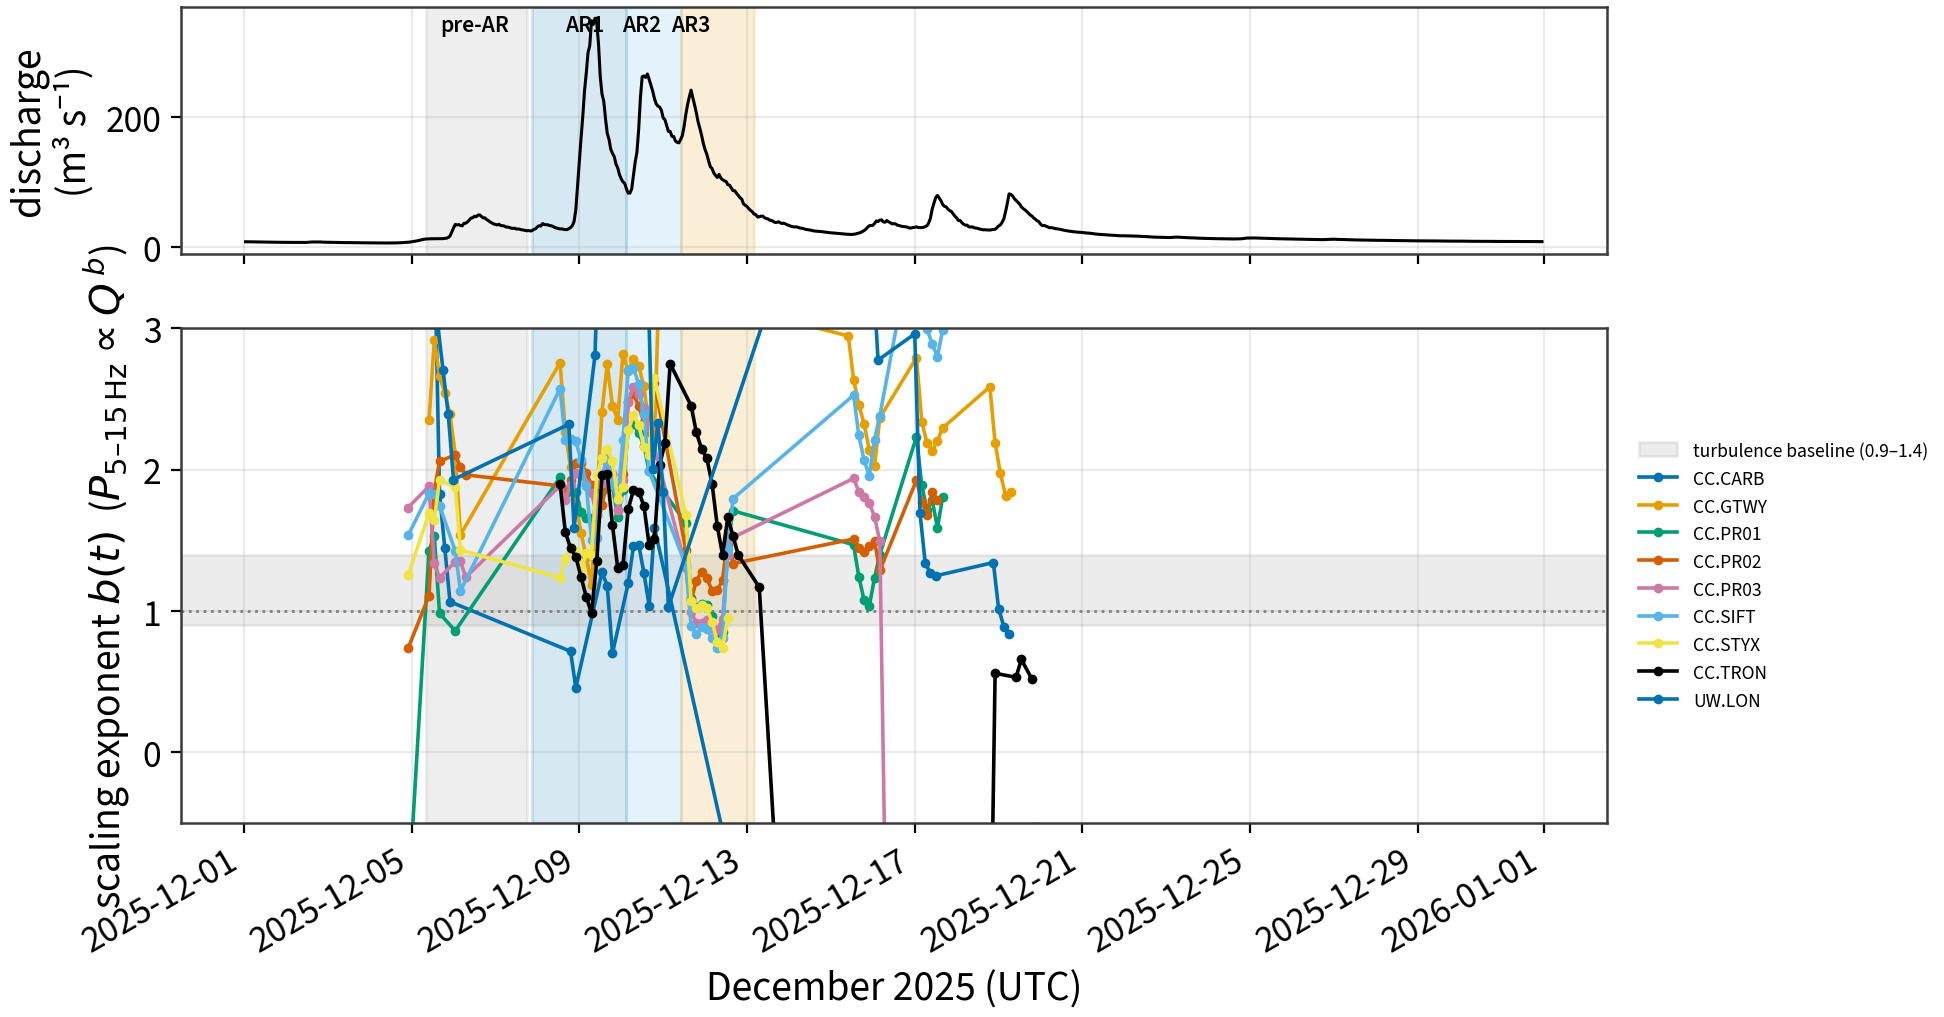
fig8_b_of_time.png | Time-resolved exponent b(t) vs turbulence baseline |
@fig-atten |
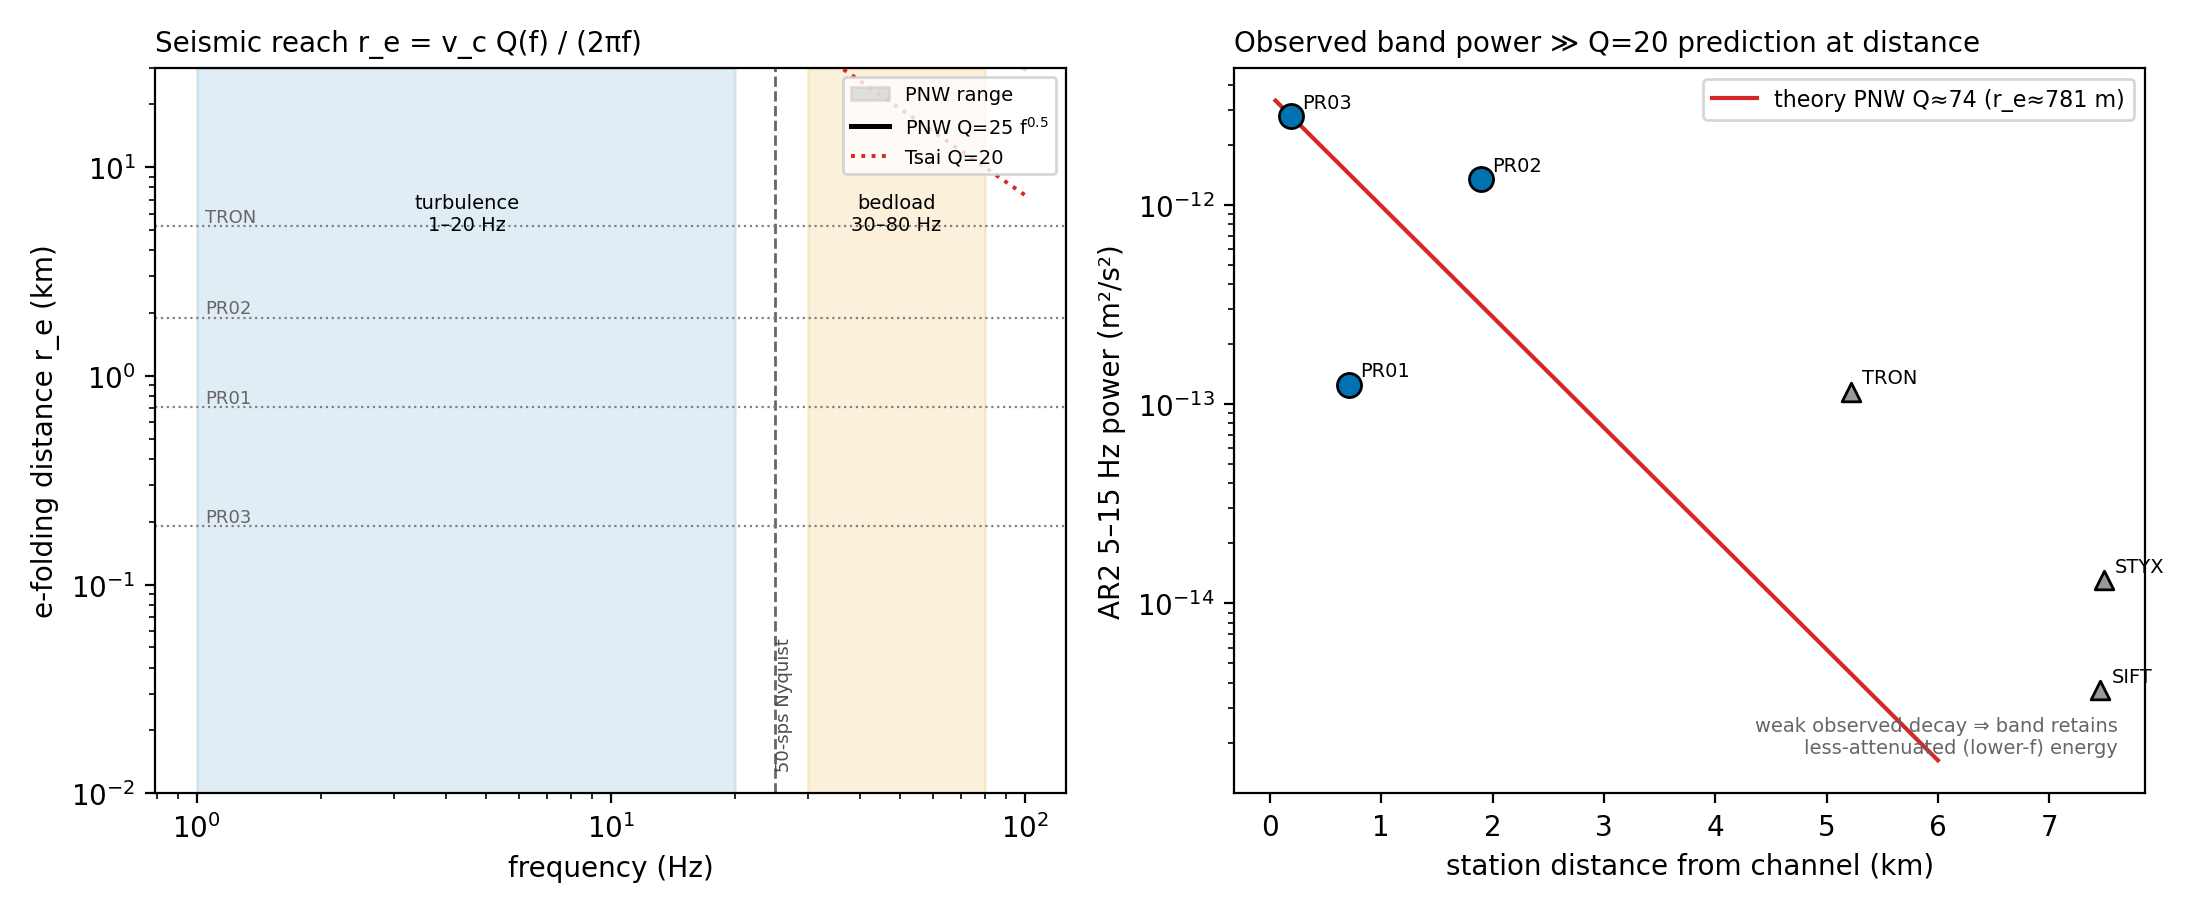
fig9_attenuation.png | PNW Q(f) attenuation correction, e-folding distance |
@fig-ew |
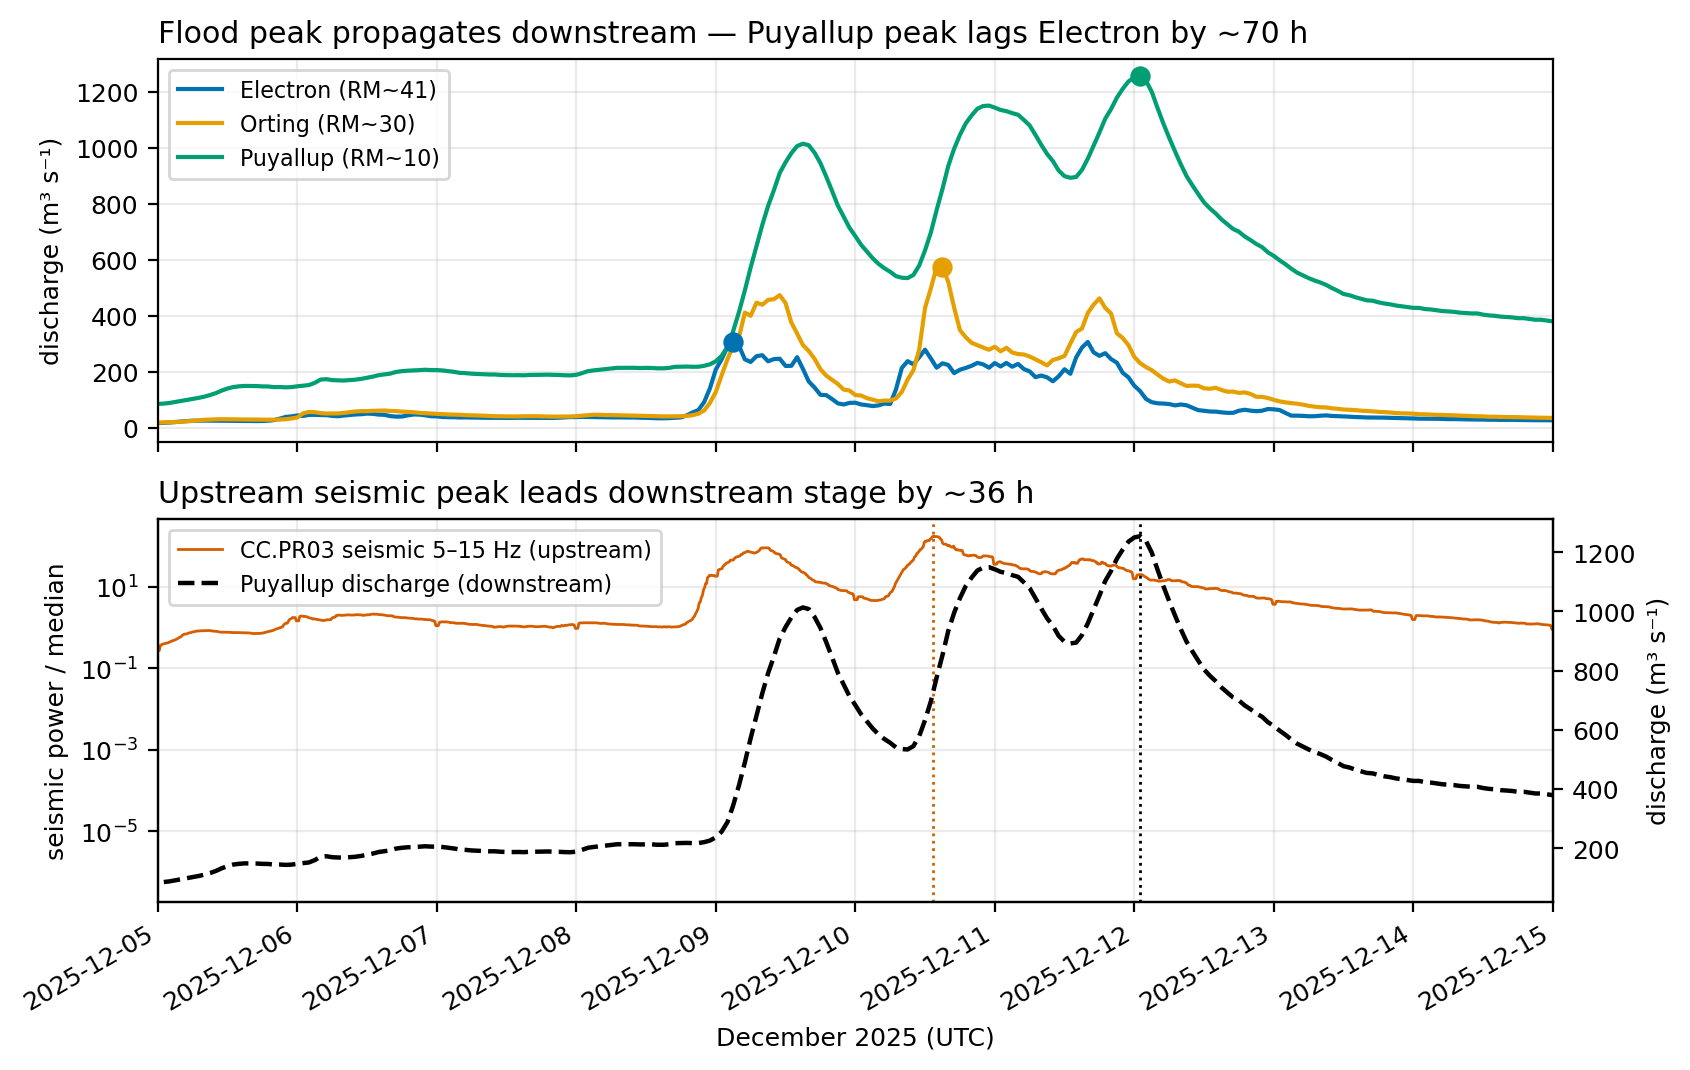
fig10_early_warning.png | Upstream seismic leads downstream stage peak (~36 h) |
@fig-spec |
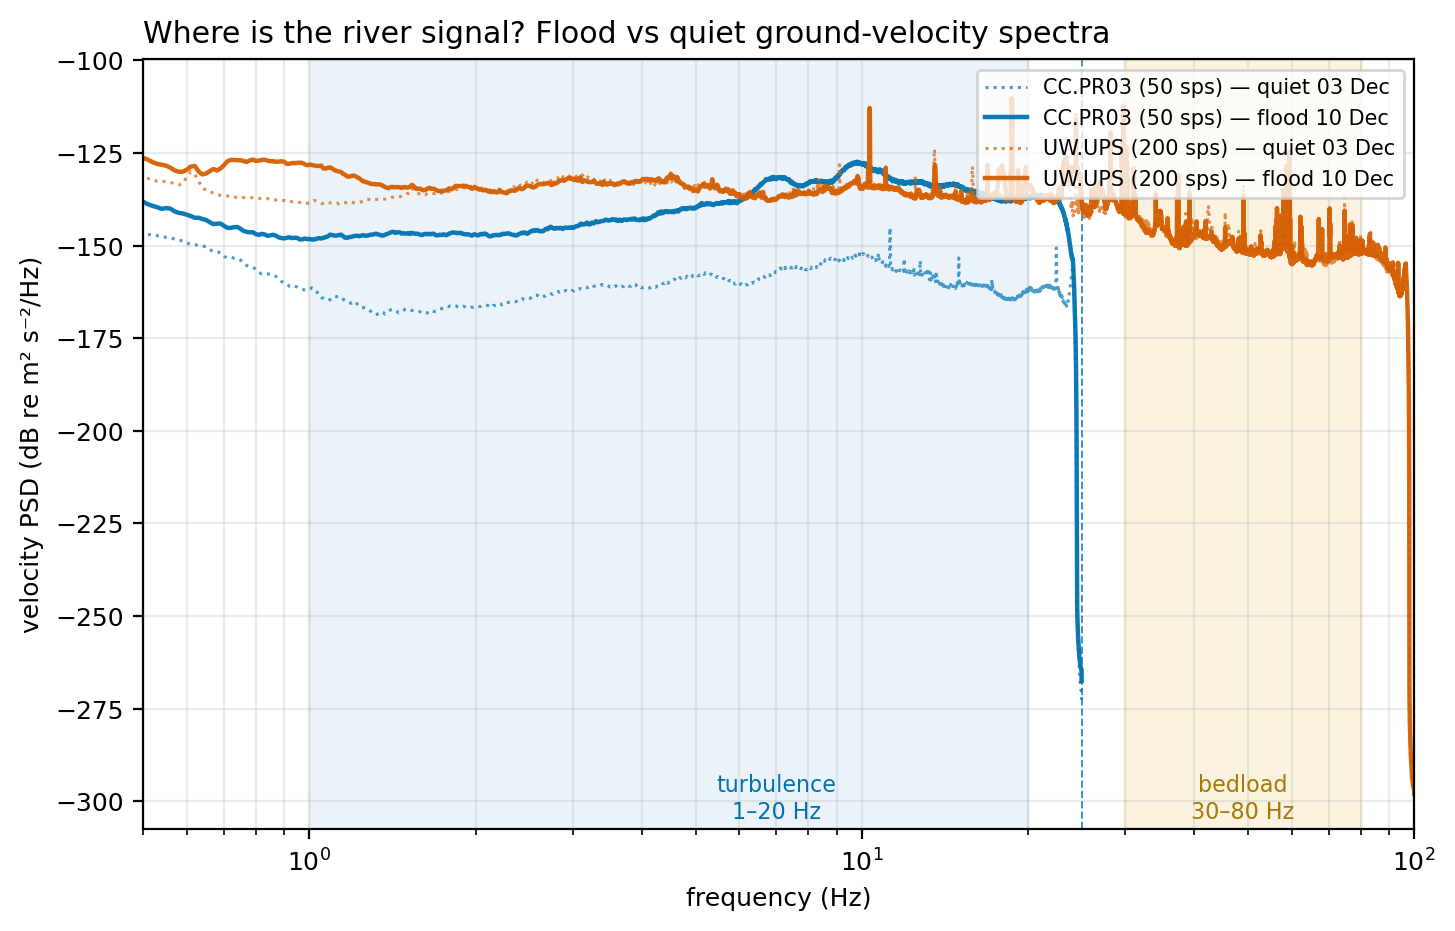
fig11_spectra.png | Flood-vs-quiet PSD: 50-sps source (≤25 Hz) vs 200-sps lowland |
@fig-vqval |
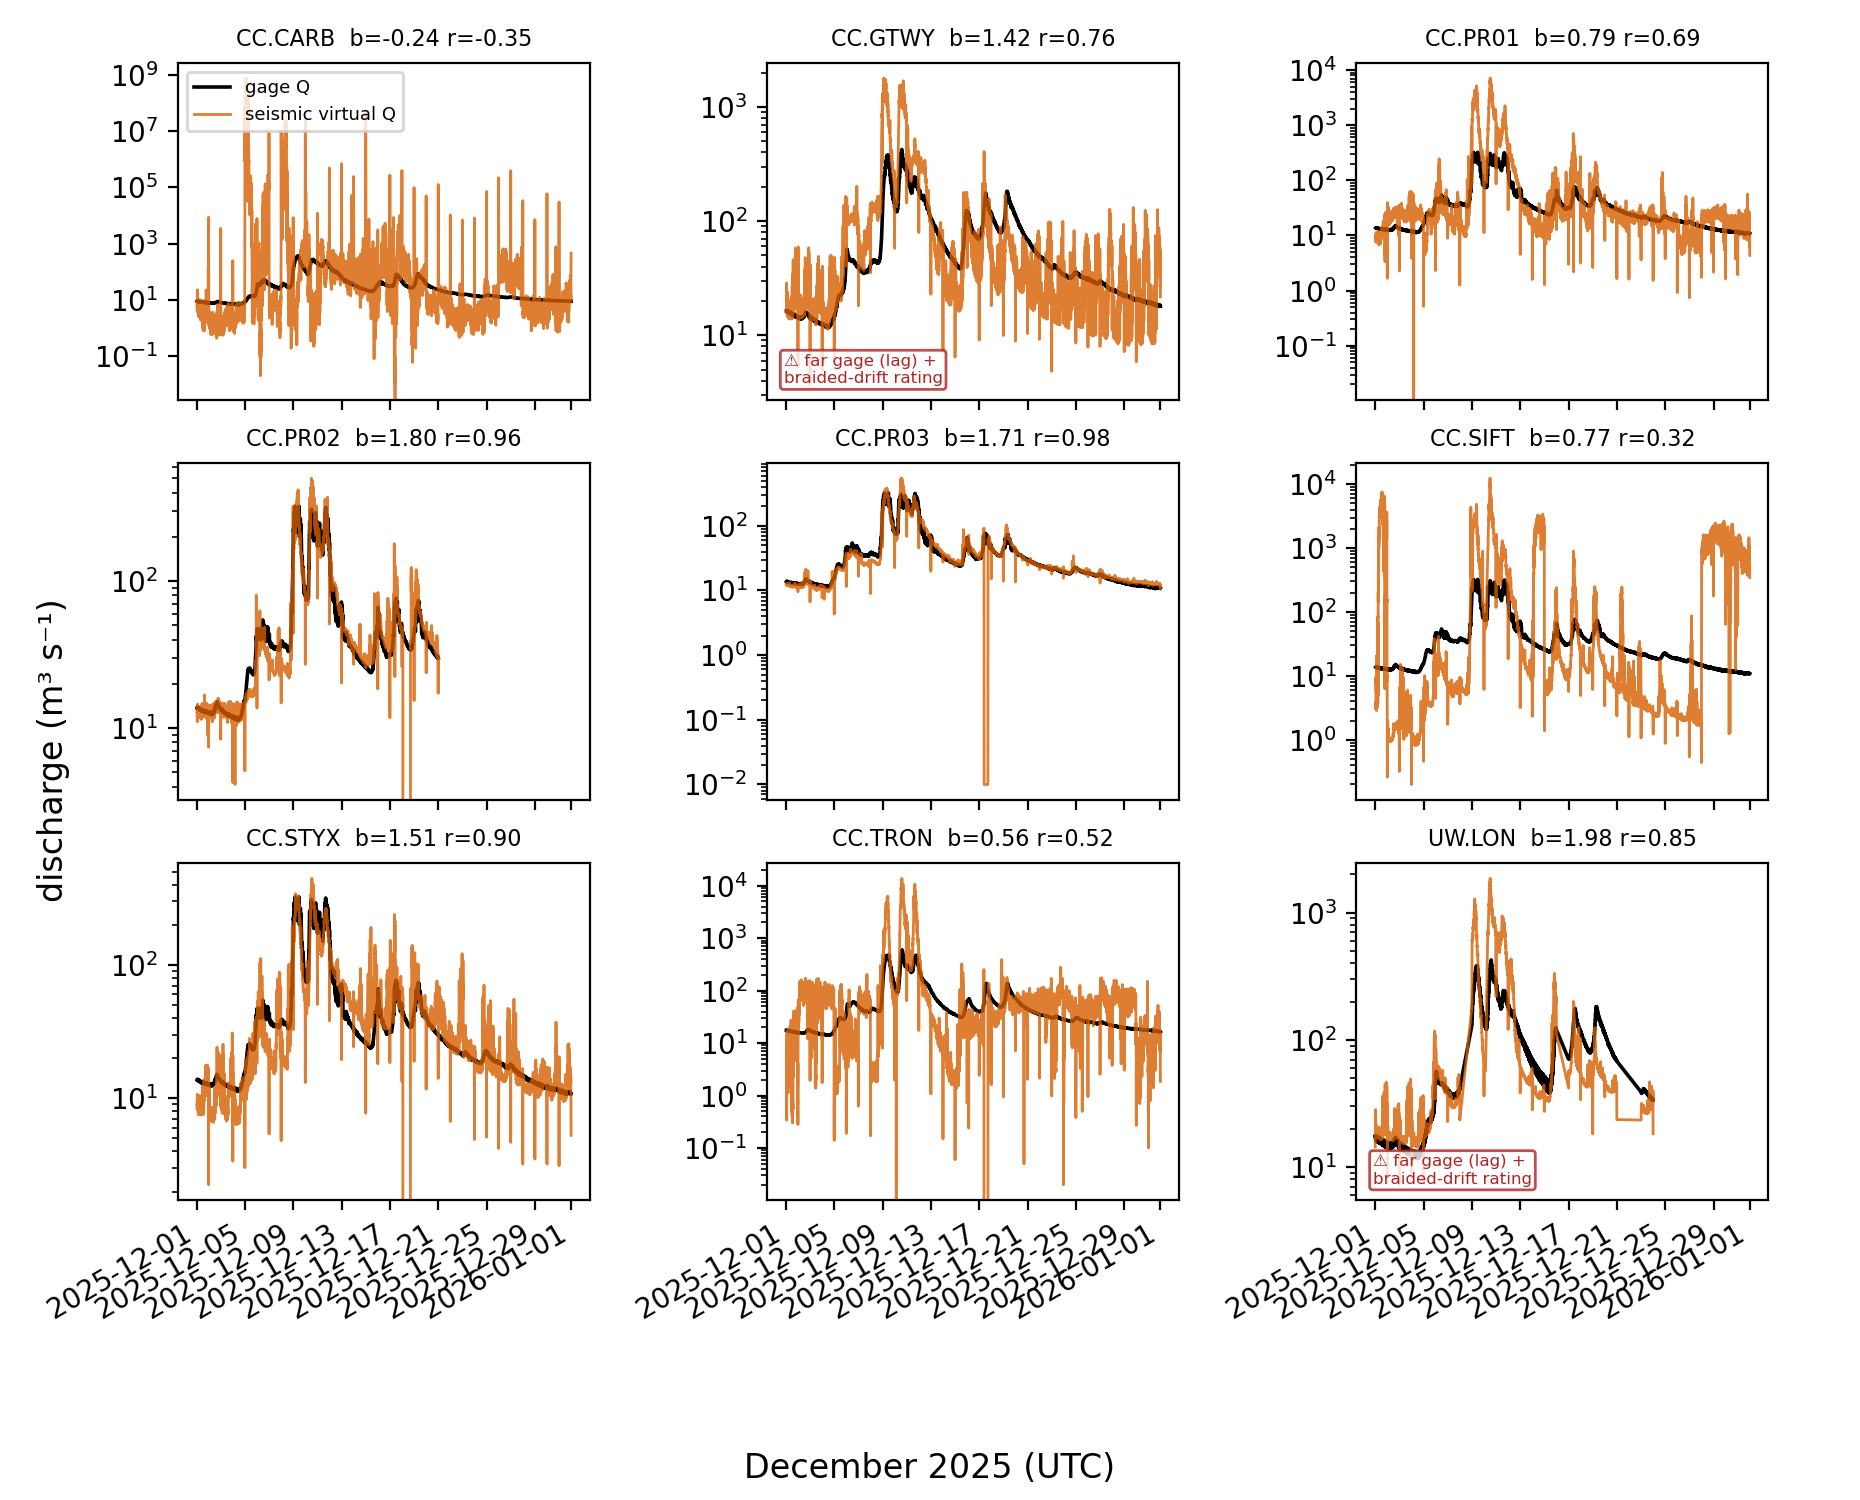
fig12_virtual_q.png | Seismic virtual discharge vs co-located gage, per station |
@fig-edge |
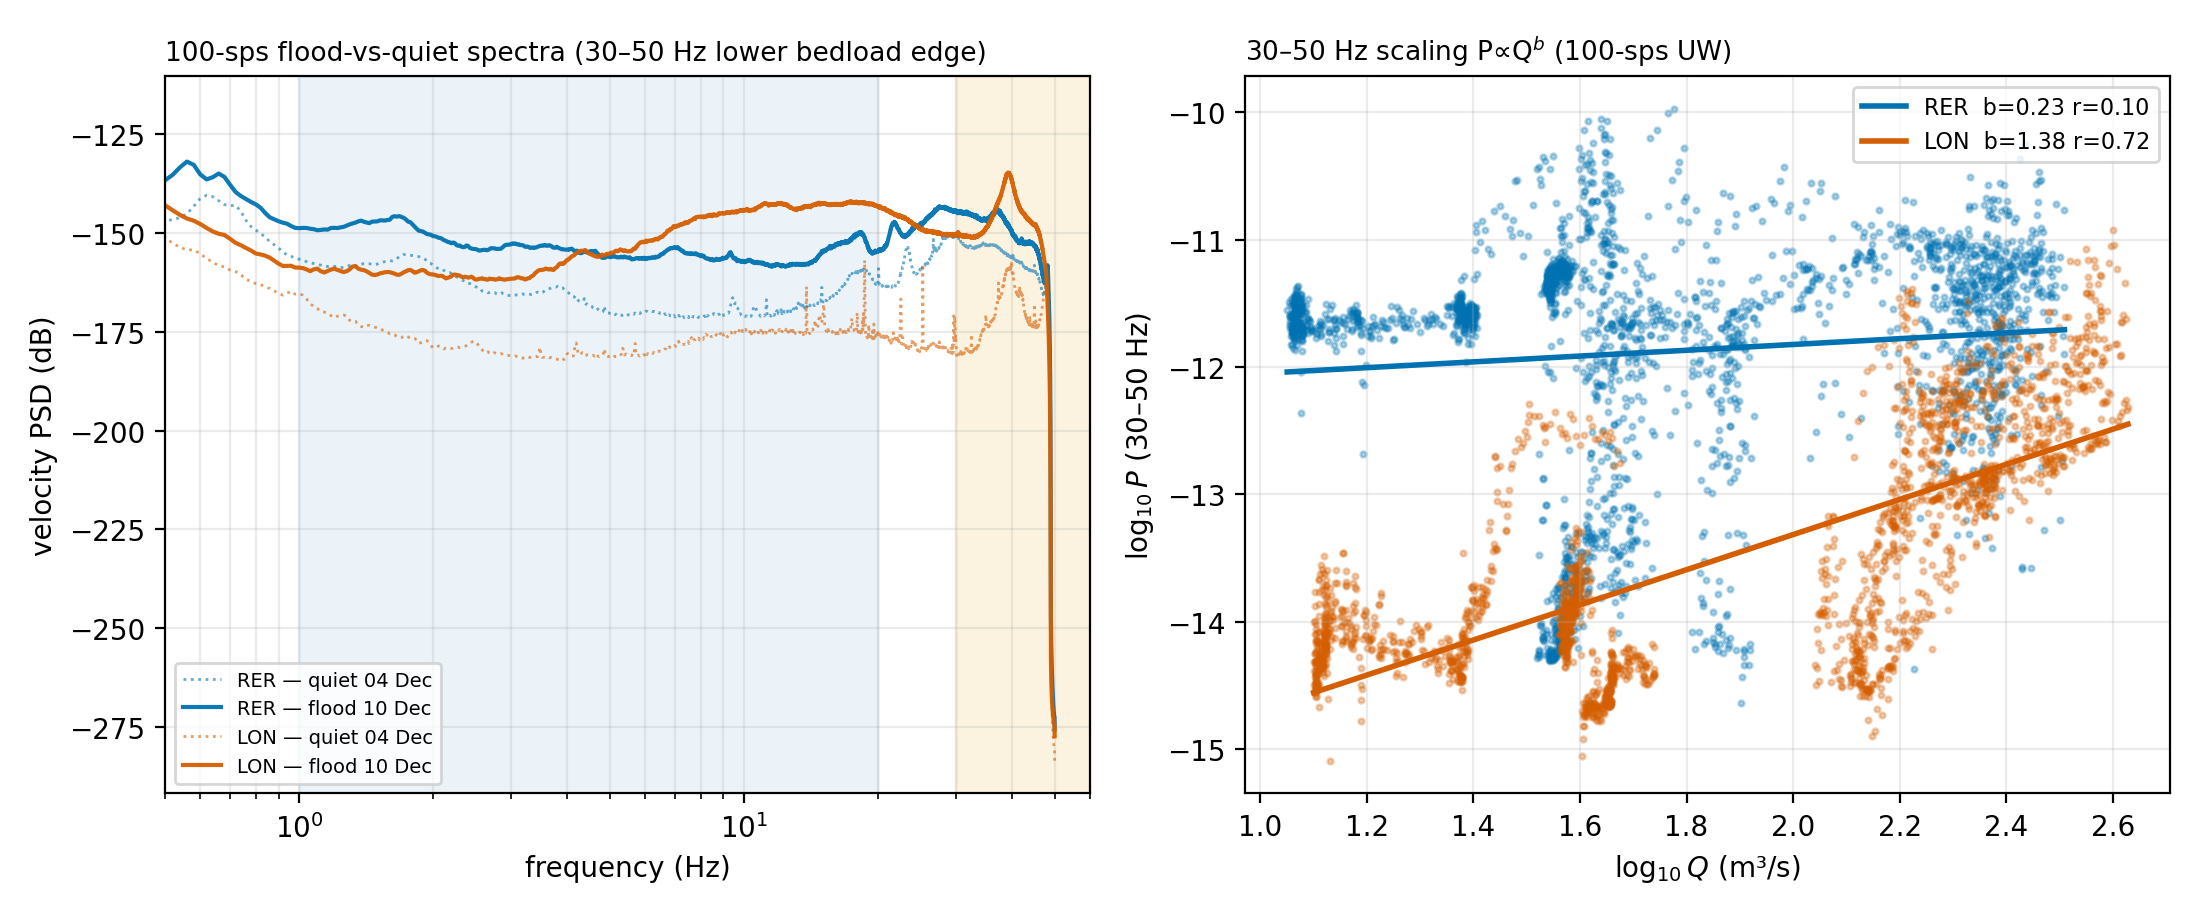
fig13_bedload_ch.png | 30–50 Hz bedload edge from 100-sps UW broadband |
@fig-thr |
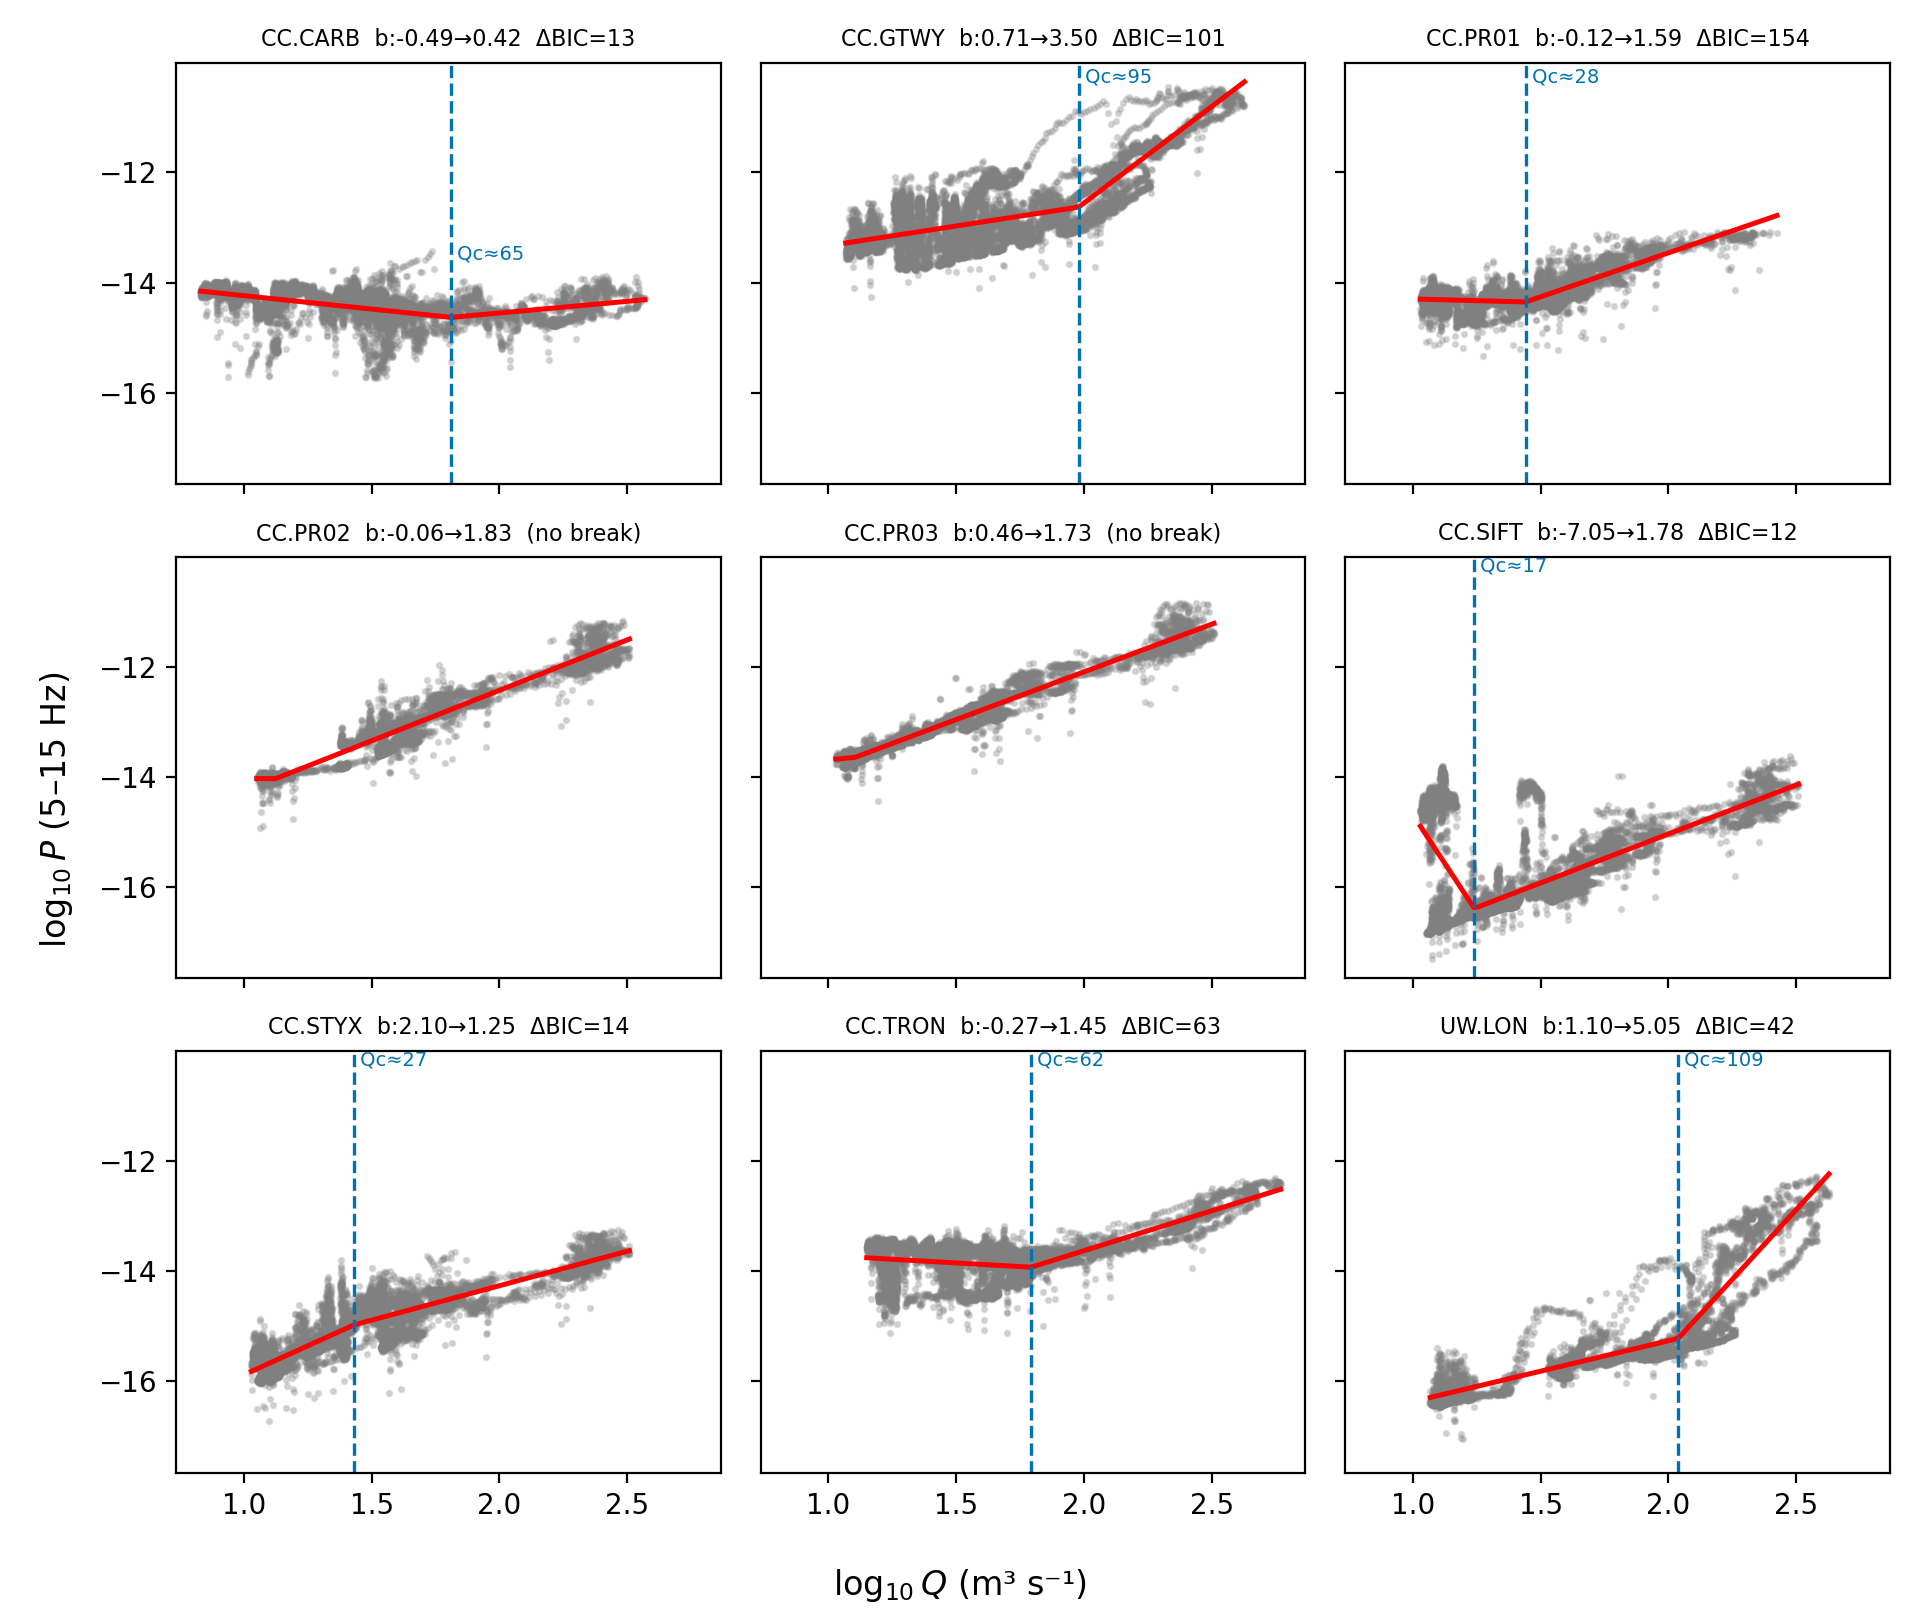
fig14_threshold.png | Broken-stick transport-onset threshold Qc |
@fig-rating |
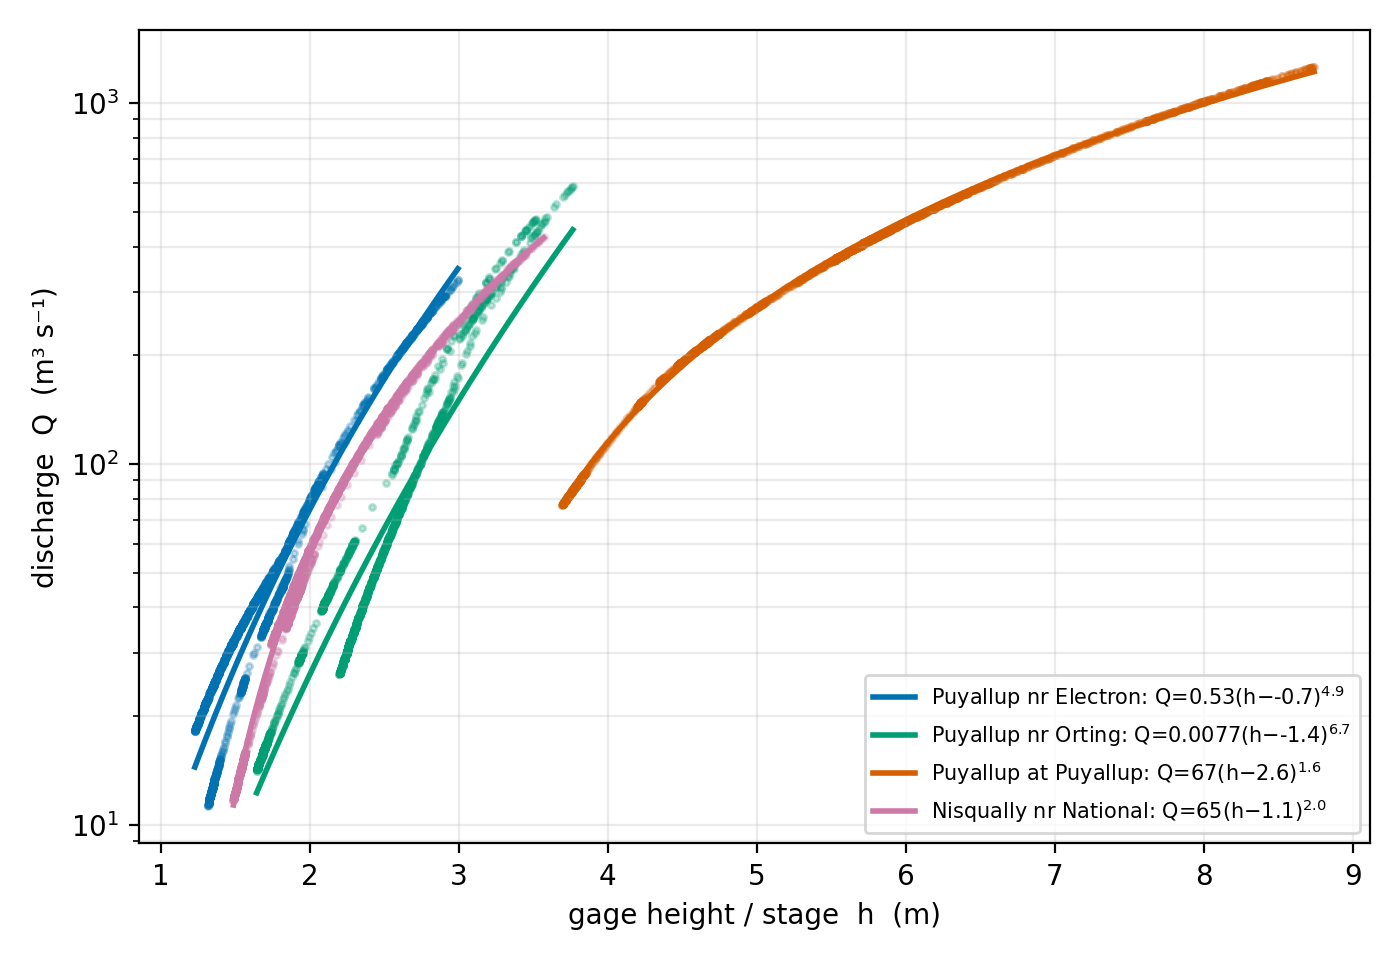
fig15_rating.png | Stage–discharge rating Q=C(h−h0)^β at 4 gages |
@fig-braid |
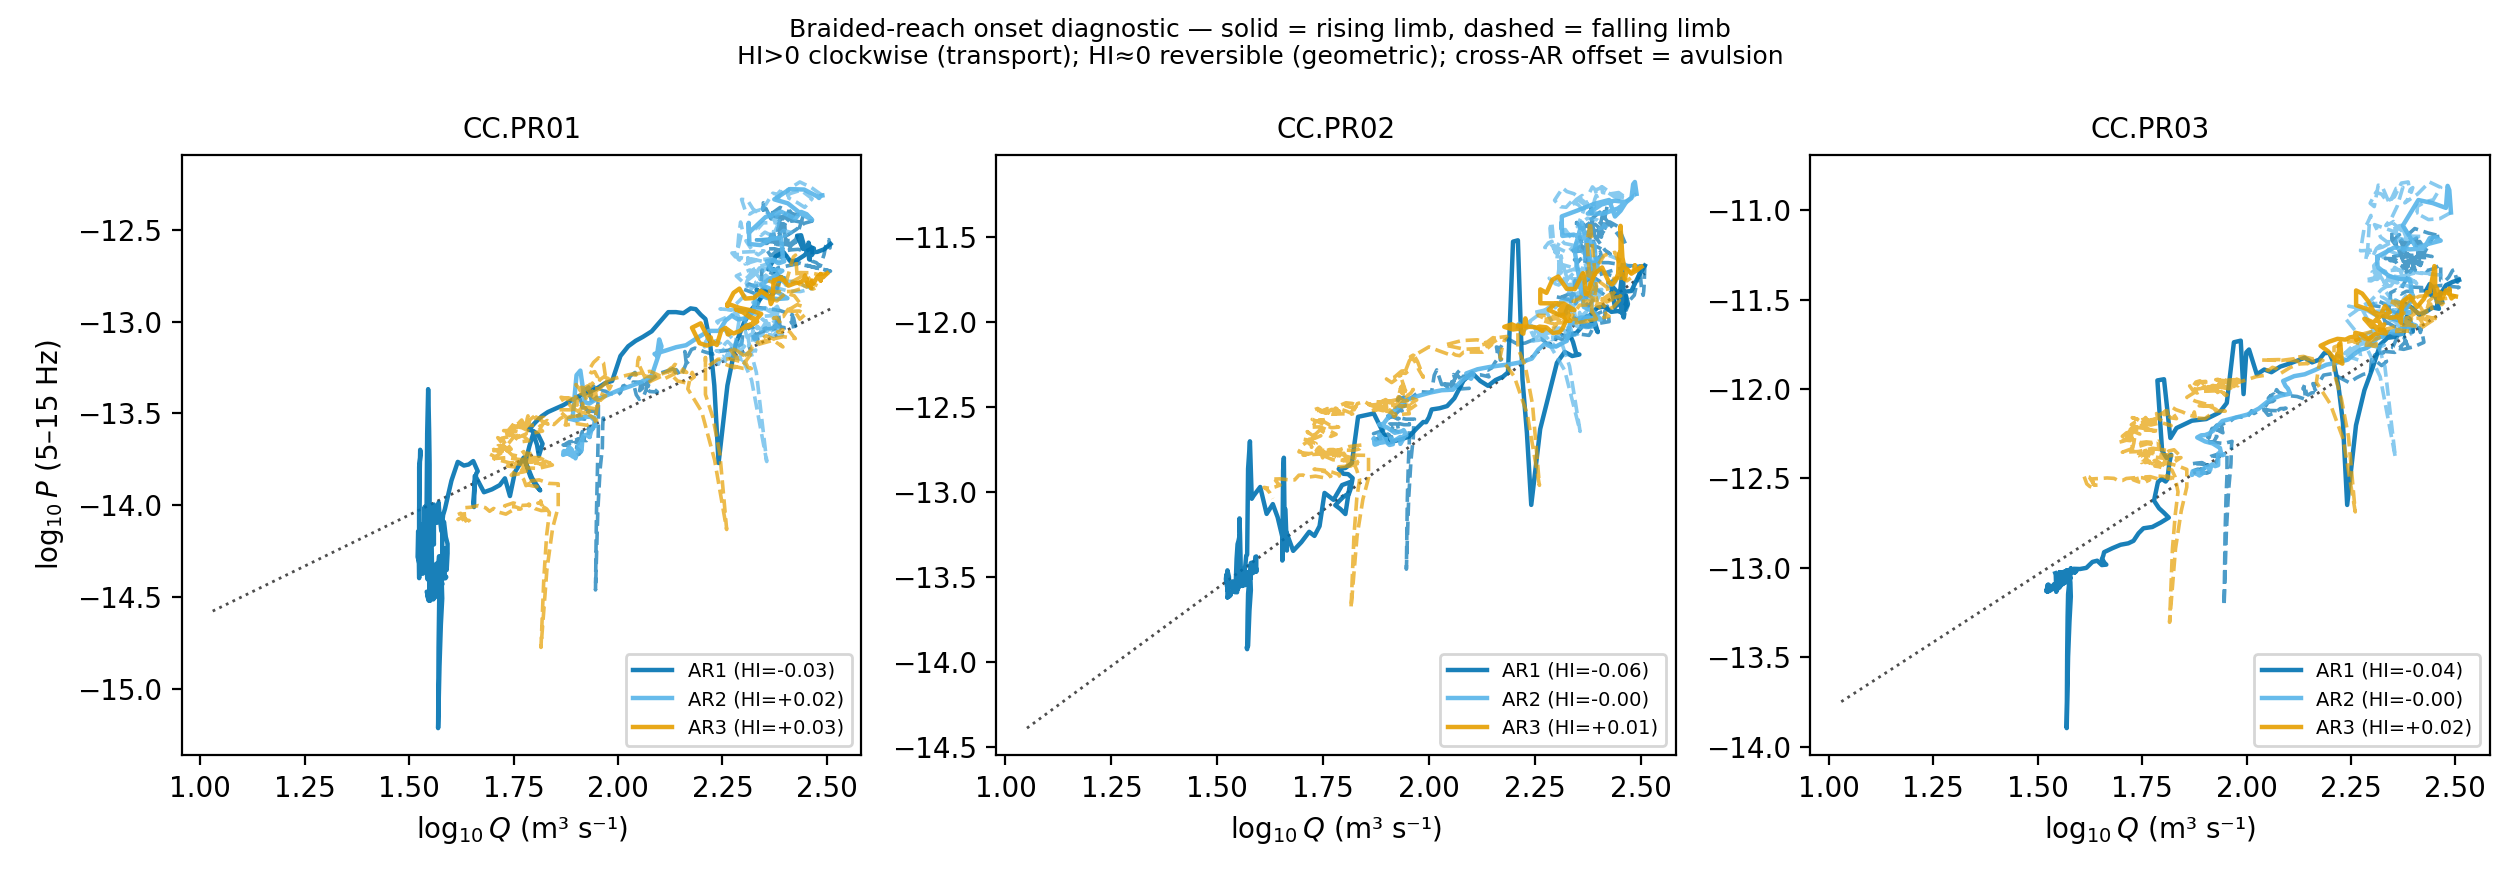
fig16_braided_hysteresis.png | Braided-reach onset diagnostic (geometric vs transport) |
@fig-braidsat |
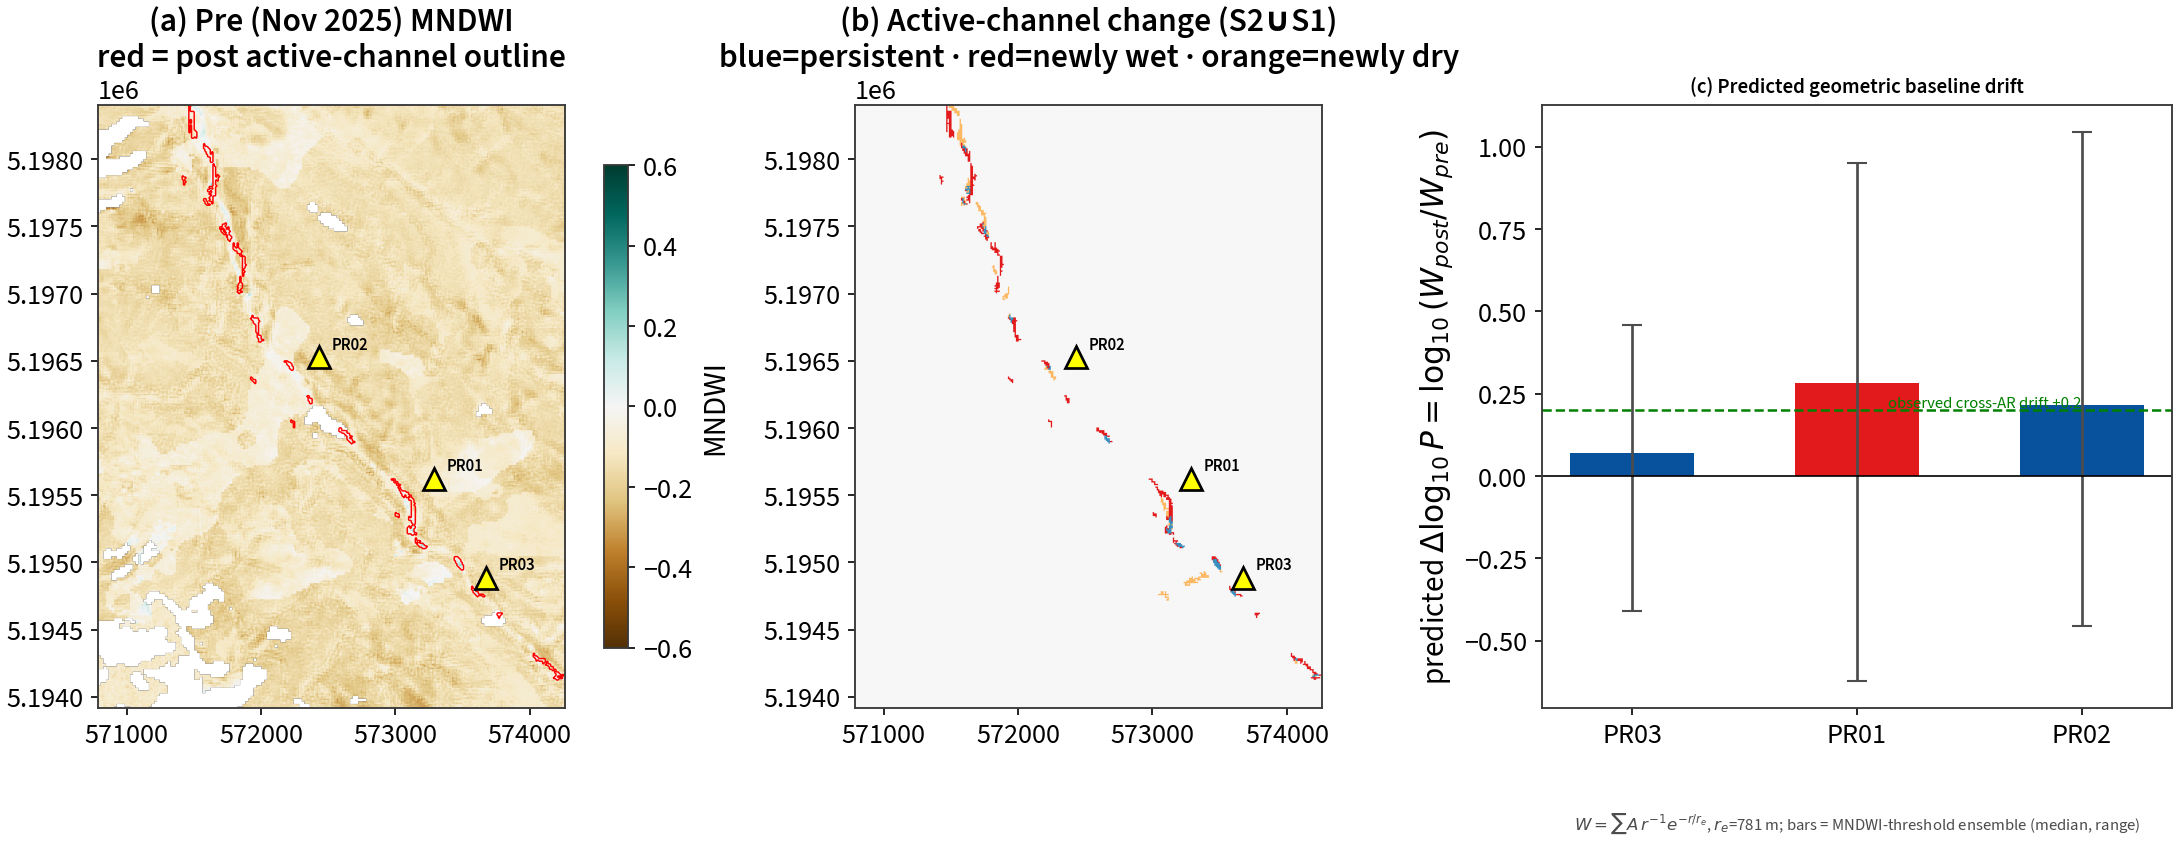
fig19_braid_change.png | Sentinel-2/-1 braid change Nov→Jan + predicted per-station geometric baseline drift |
@fig-warmsnow |
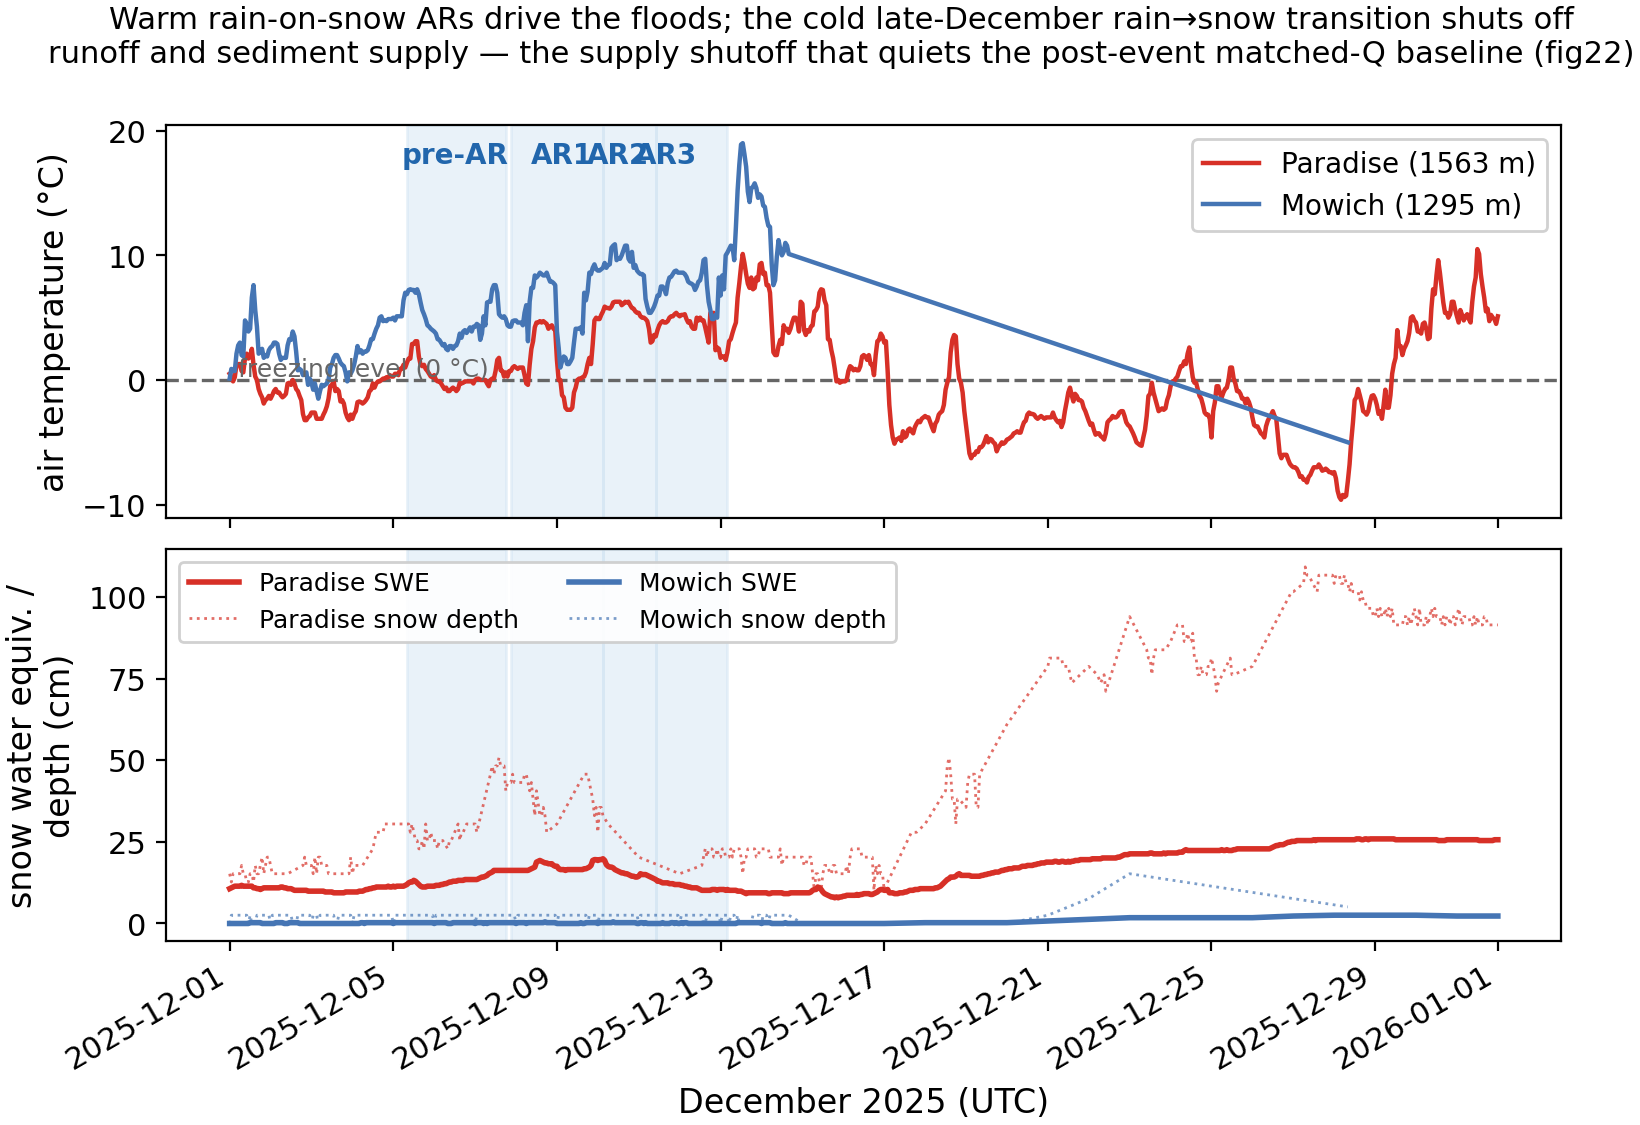
fig21_warm_ar_snow.png | High-elevation SNOTEL temperature + SWE: warm rain-on-snow ARs vs cold late-Dec snow accumulation |
@fig-reorg |
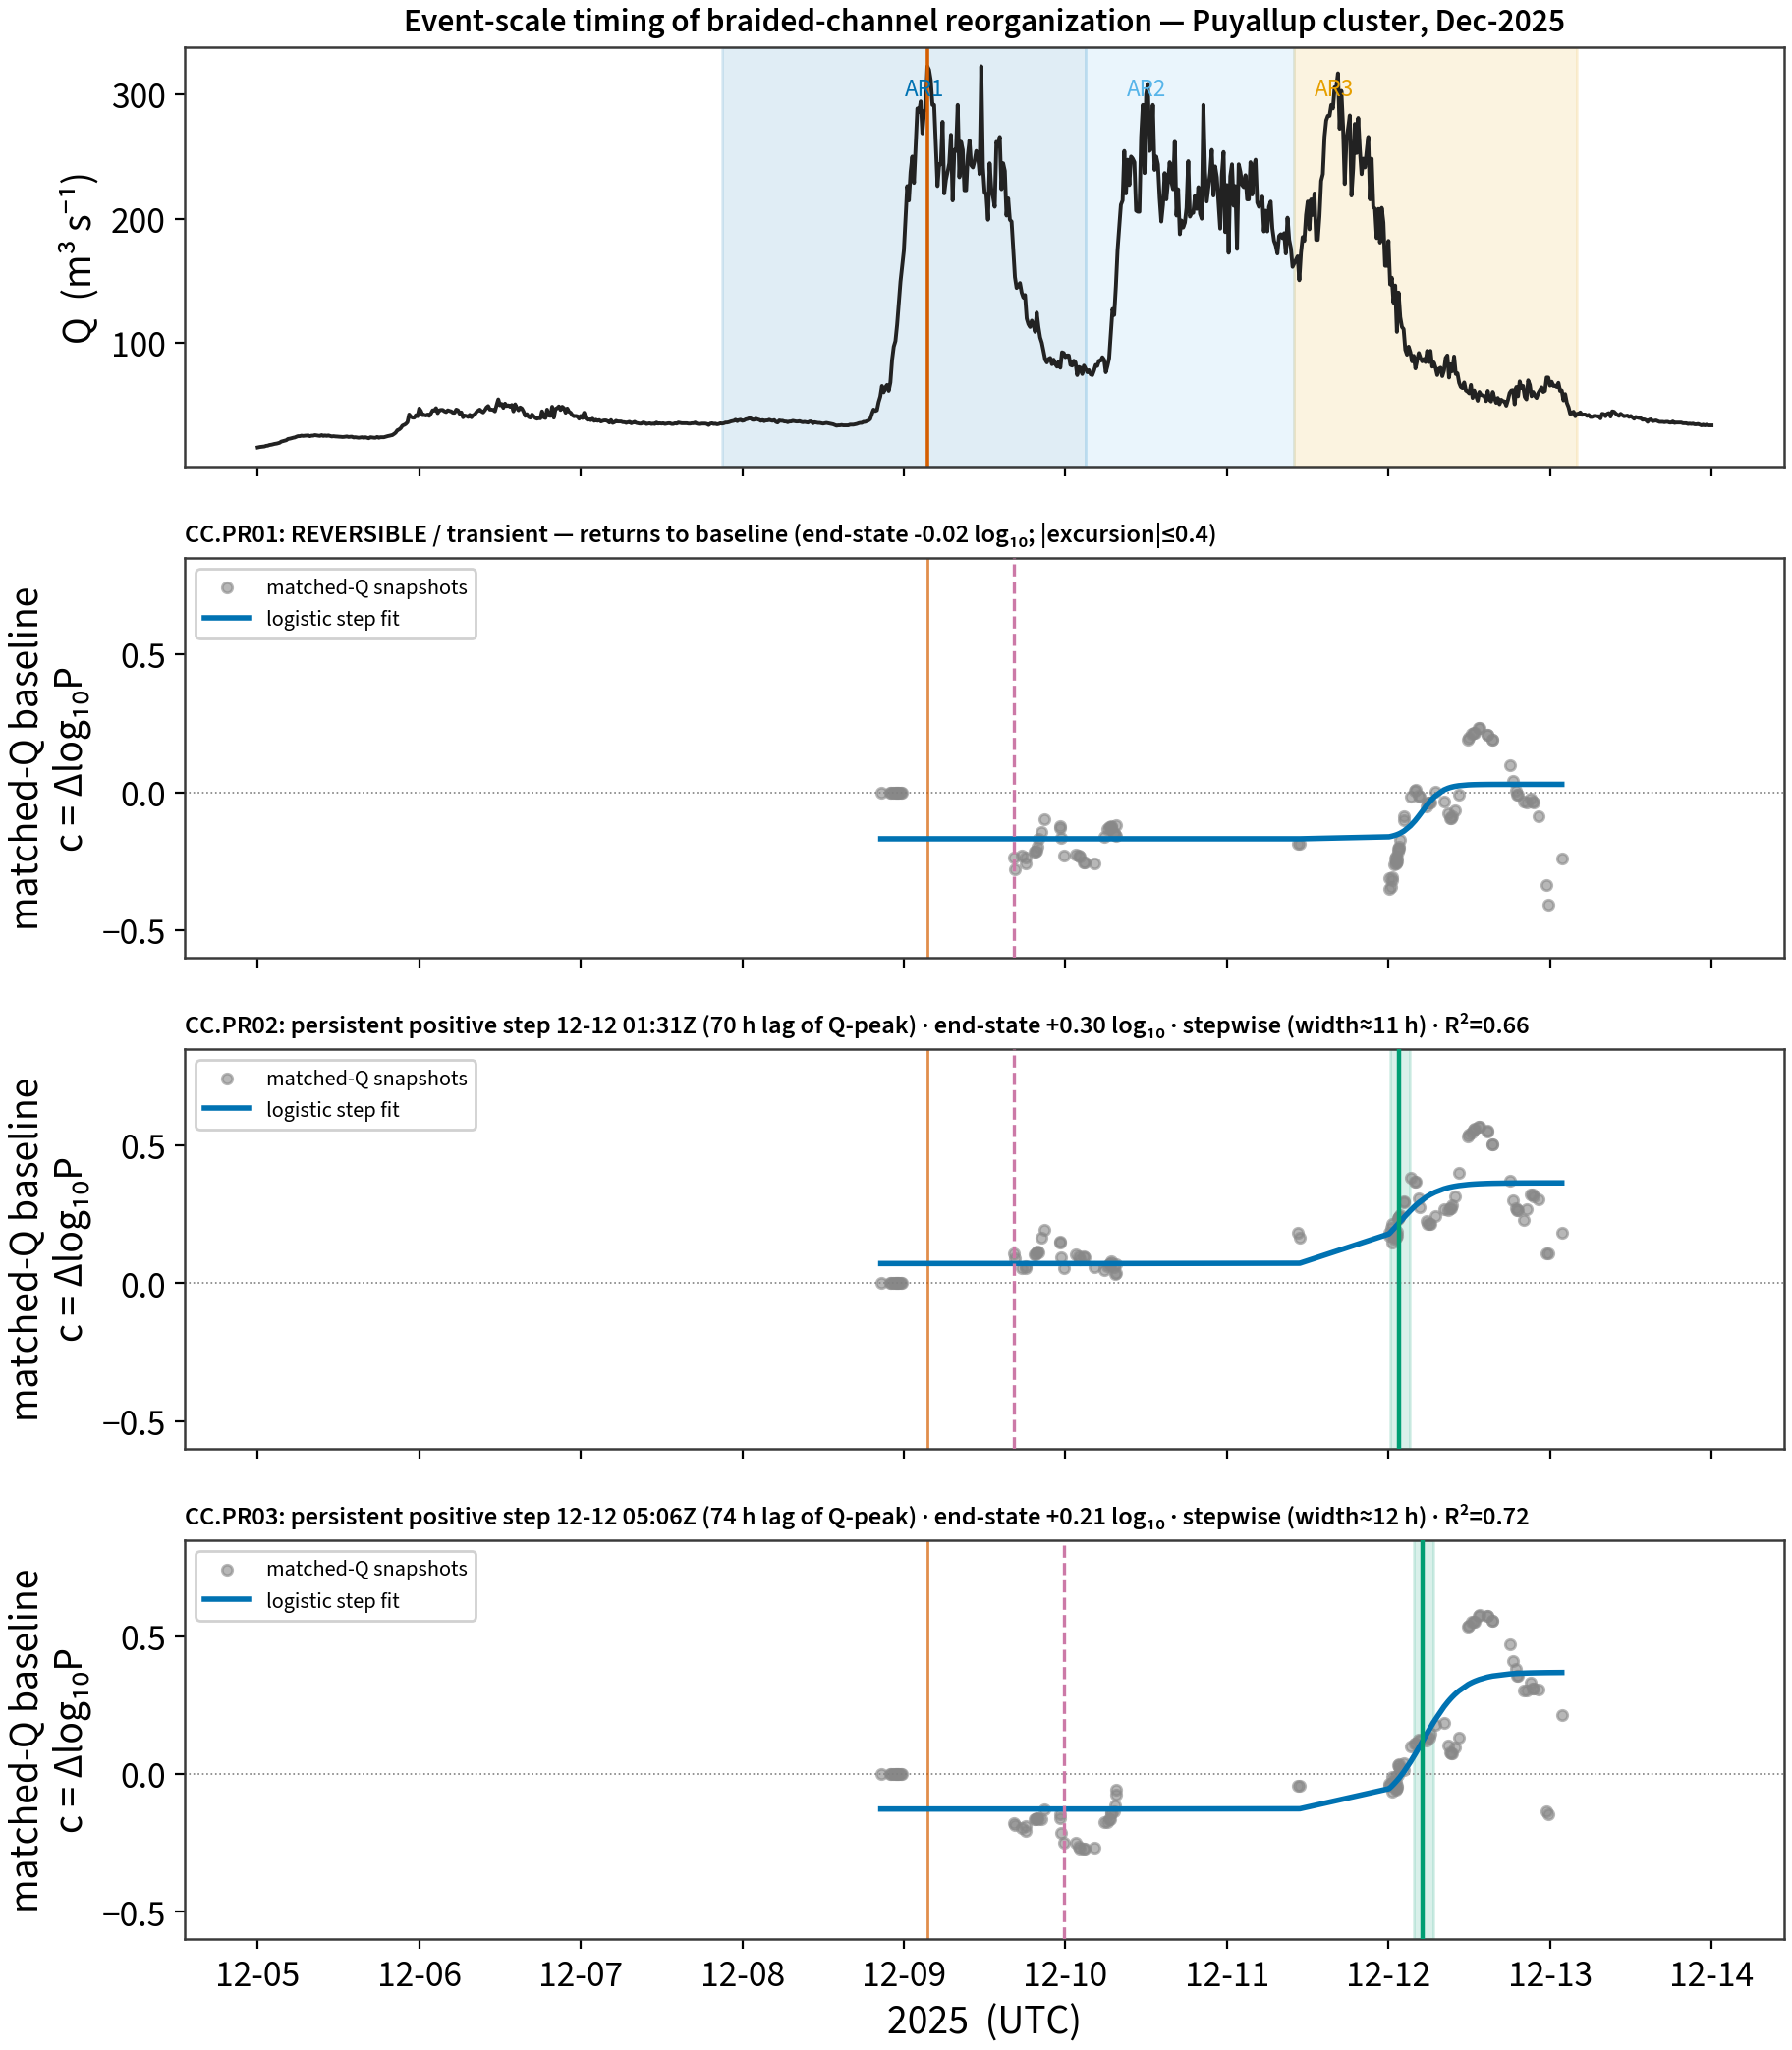
fig22_braided_reorg_timing.png | Event-scale reorganization TIMING (×2 basins, lag-corrected): matched-Q baseline, logistic step, onset/lead-lag vs peak Q |
@fig-domain |
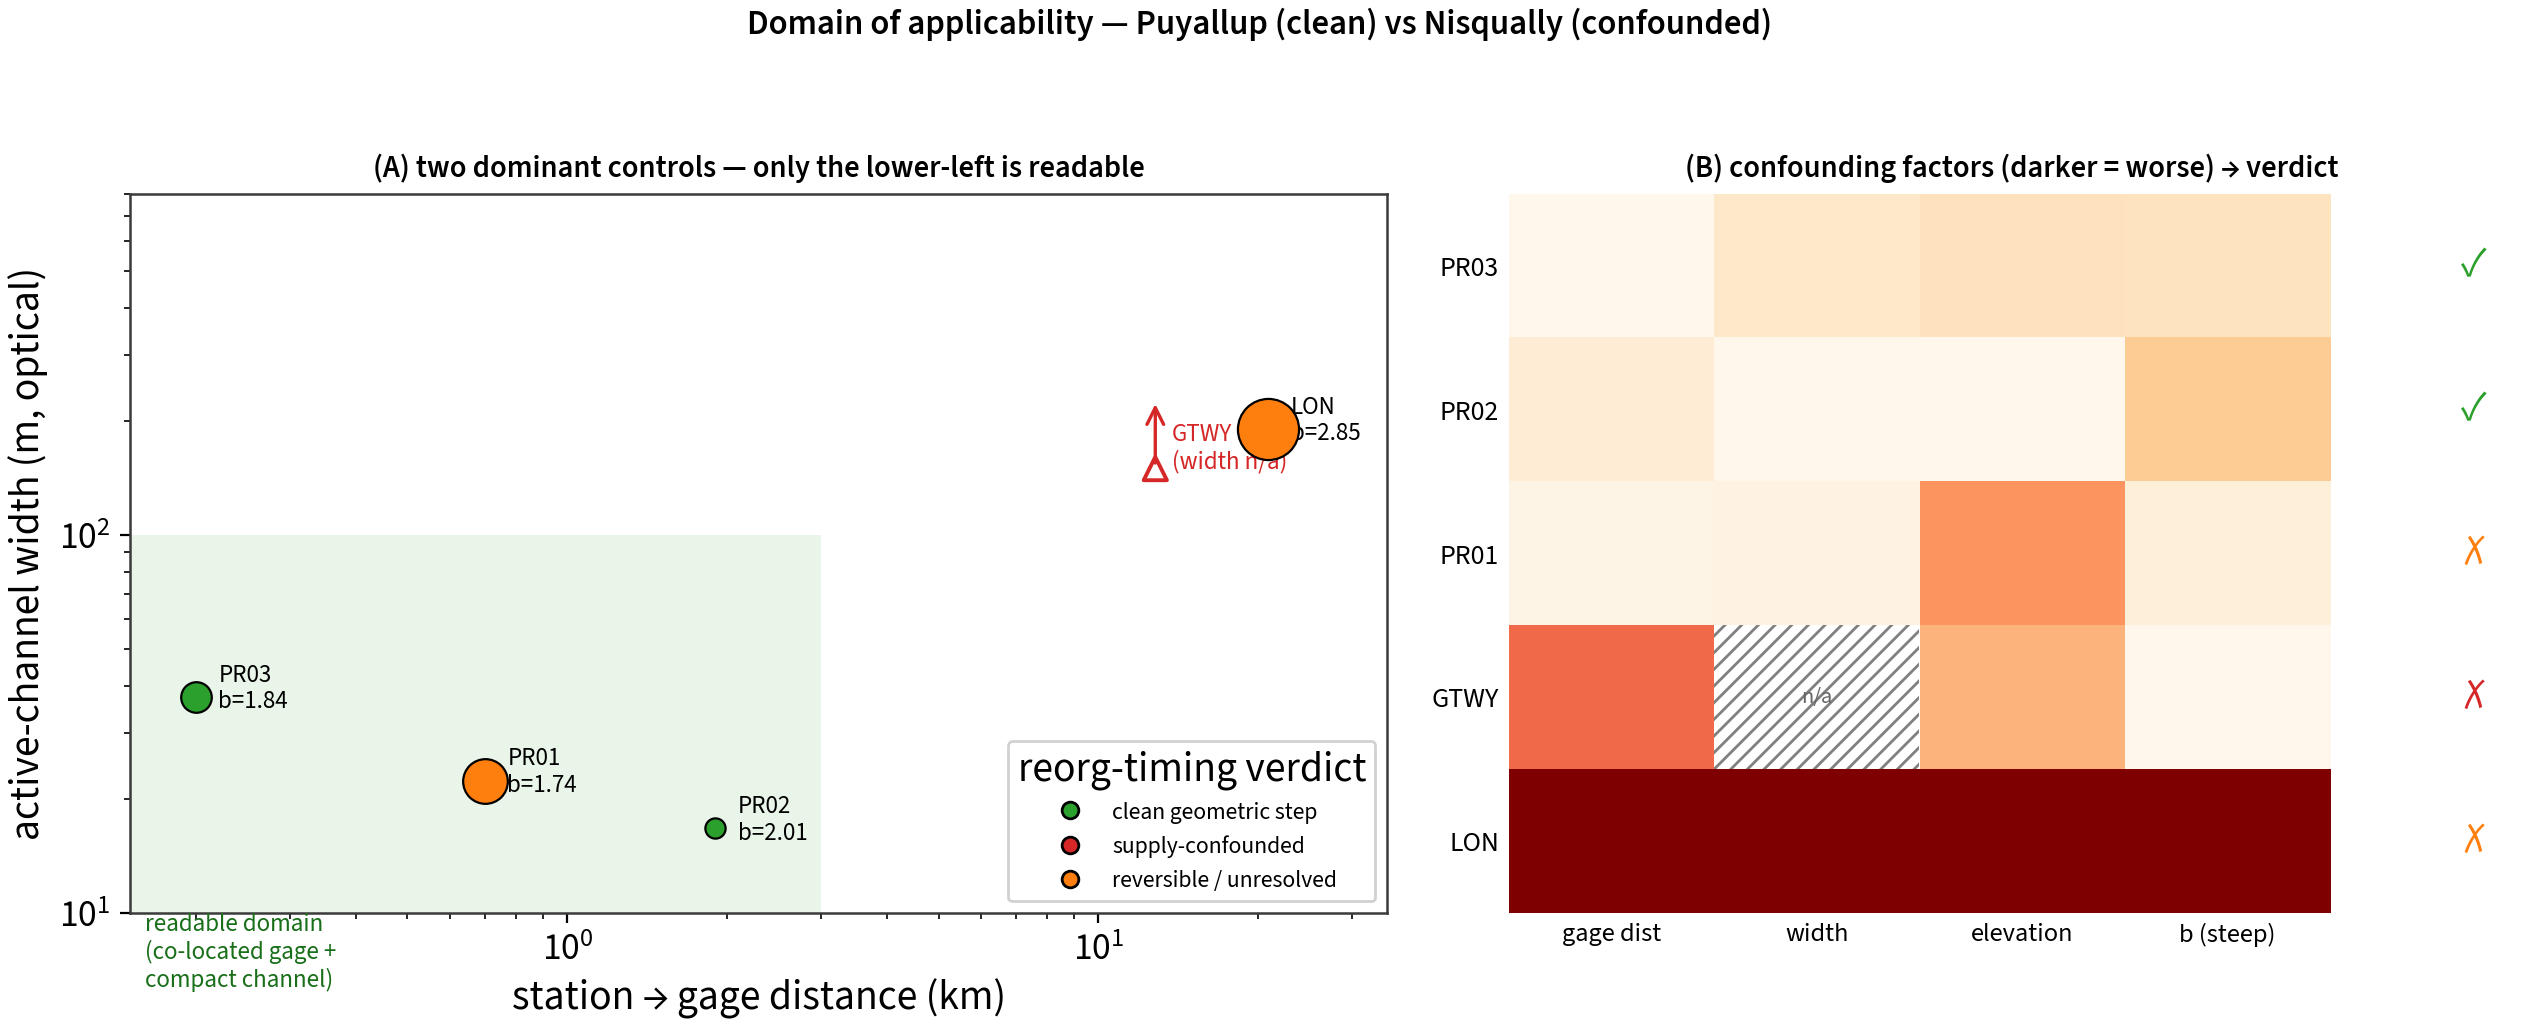
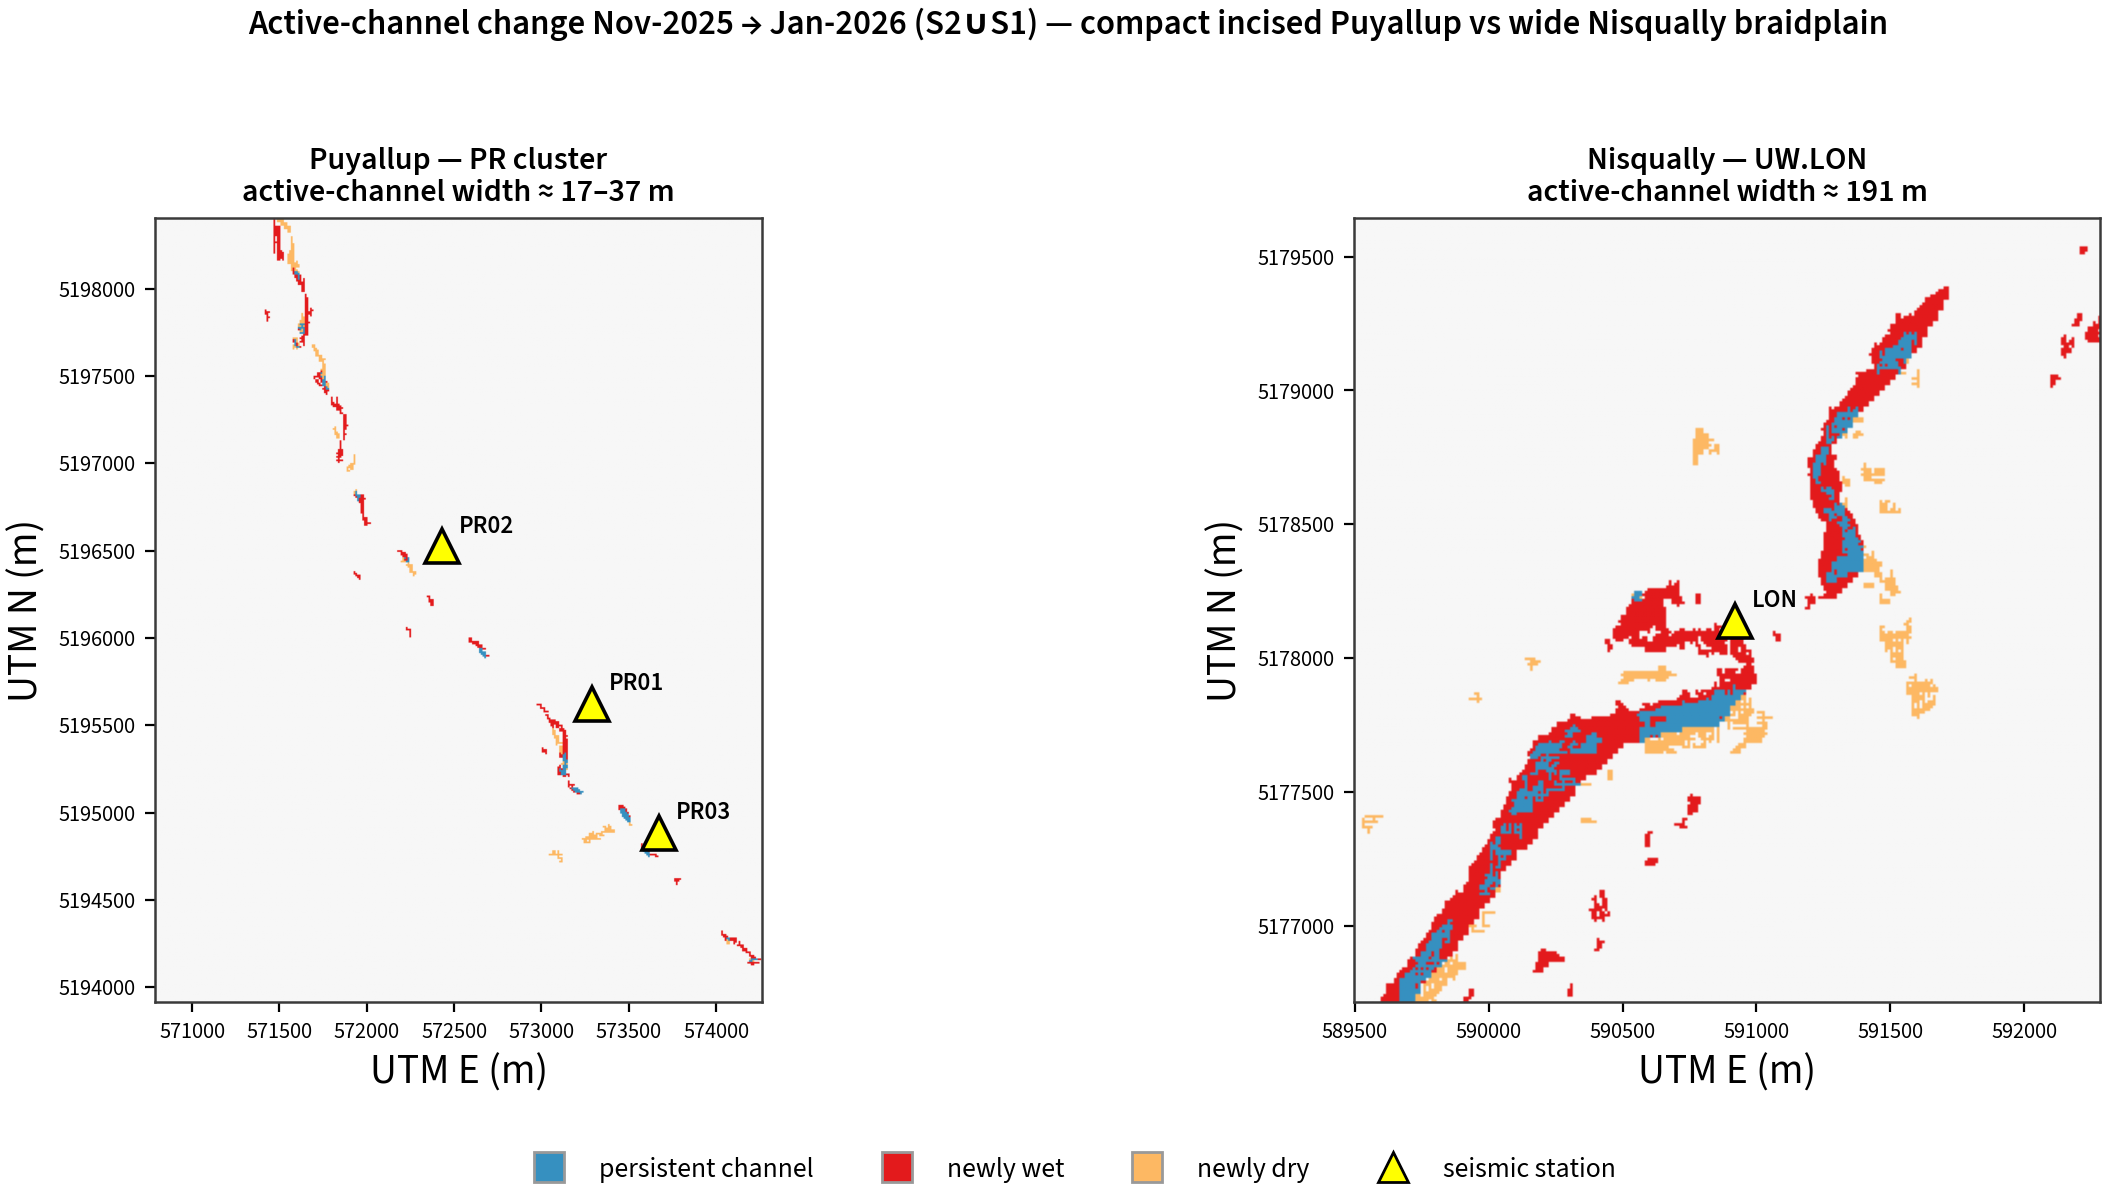
fig23_domain.png | Domain of applicability: gage-distance × channel-width × elevation → clean (Puyallup) vs confounded (Nisqually) |
@fig-tworeg |
fig24_braid_two_region.png | Two-region braid-change: compact incised Puyallup vs wide Nisqually braidplain (offline from cache) |
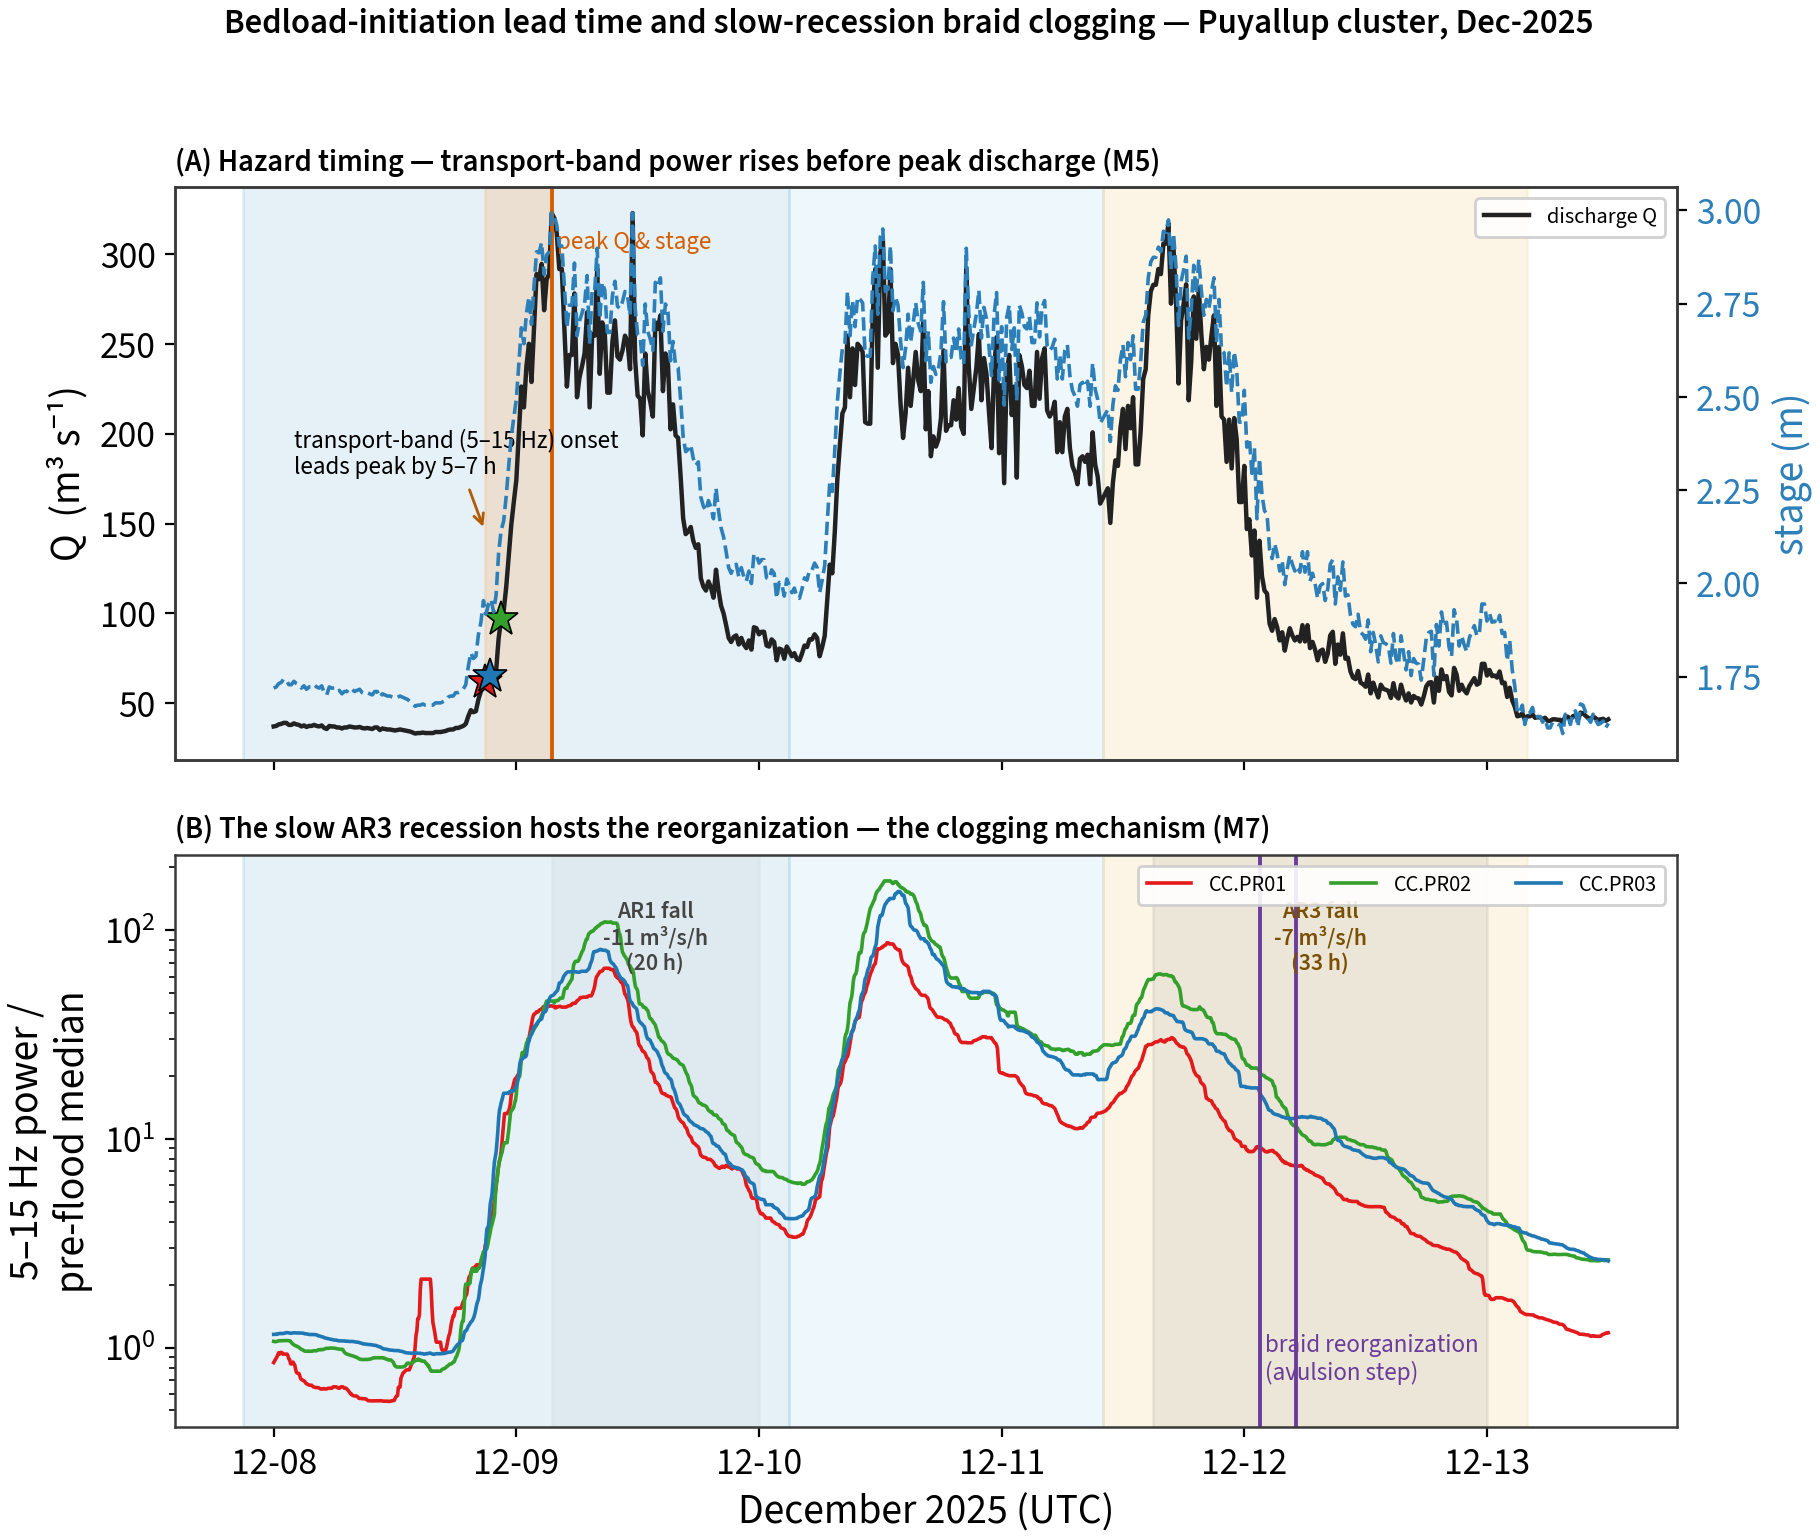
@fig-hazard |
fig25_hazard_clogging.png | Hazard timing (M5) — 5–15 Hz transport-band onset leads peak Q by ~6 h — and the slow AR3-recession braid clogging (M7) that hosts the avulsion (Montgomery feedback) |
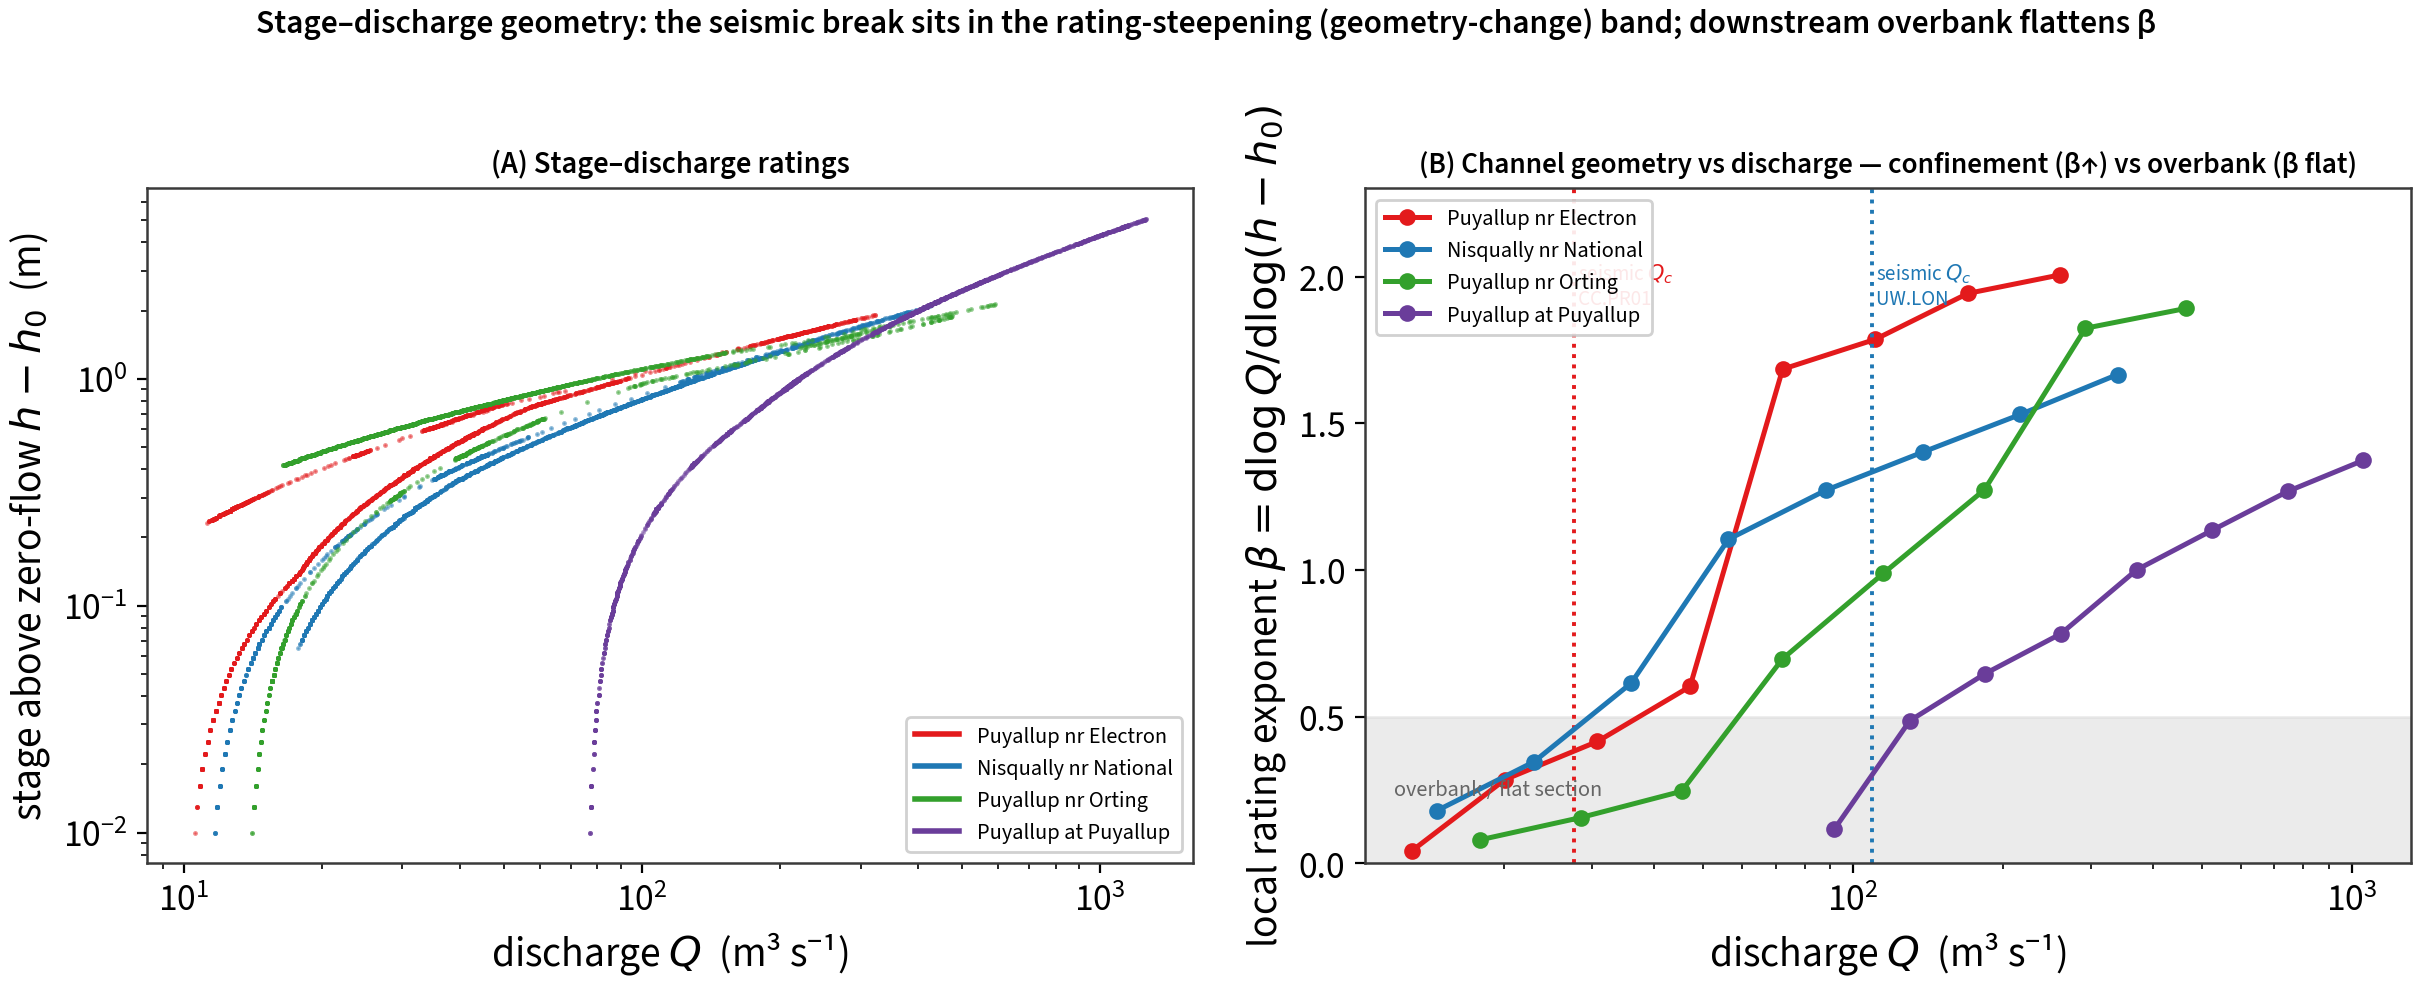
@fig-ratinggeom |
fig26_rating_geometry.png | Stage–discharge geometry (M2): rating exponent β(Q) — source-reach confinement (β→2, seismic Qc in the steepening band) vs lowland overbank (β flat) |
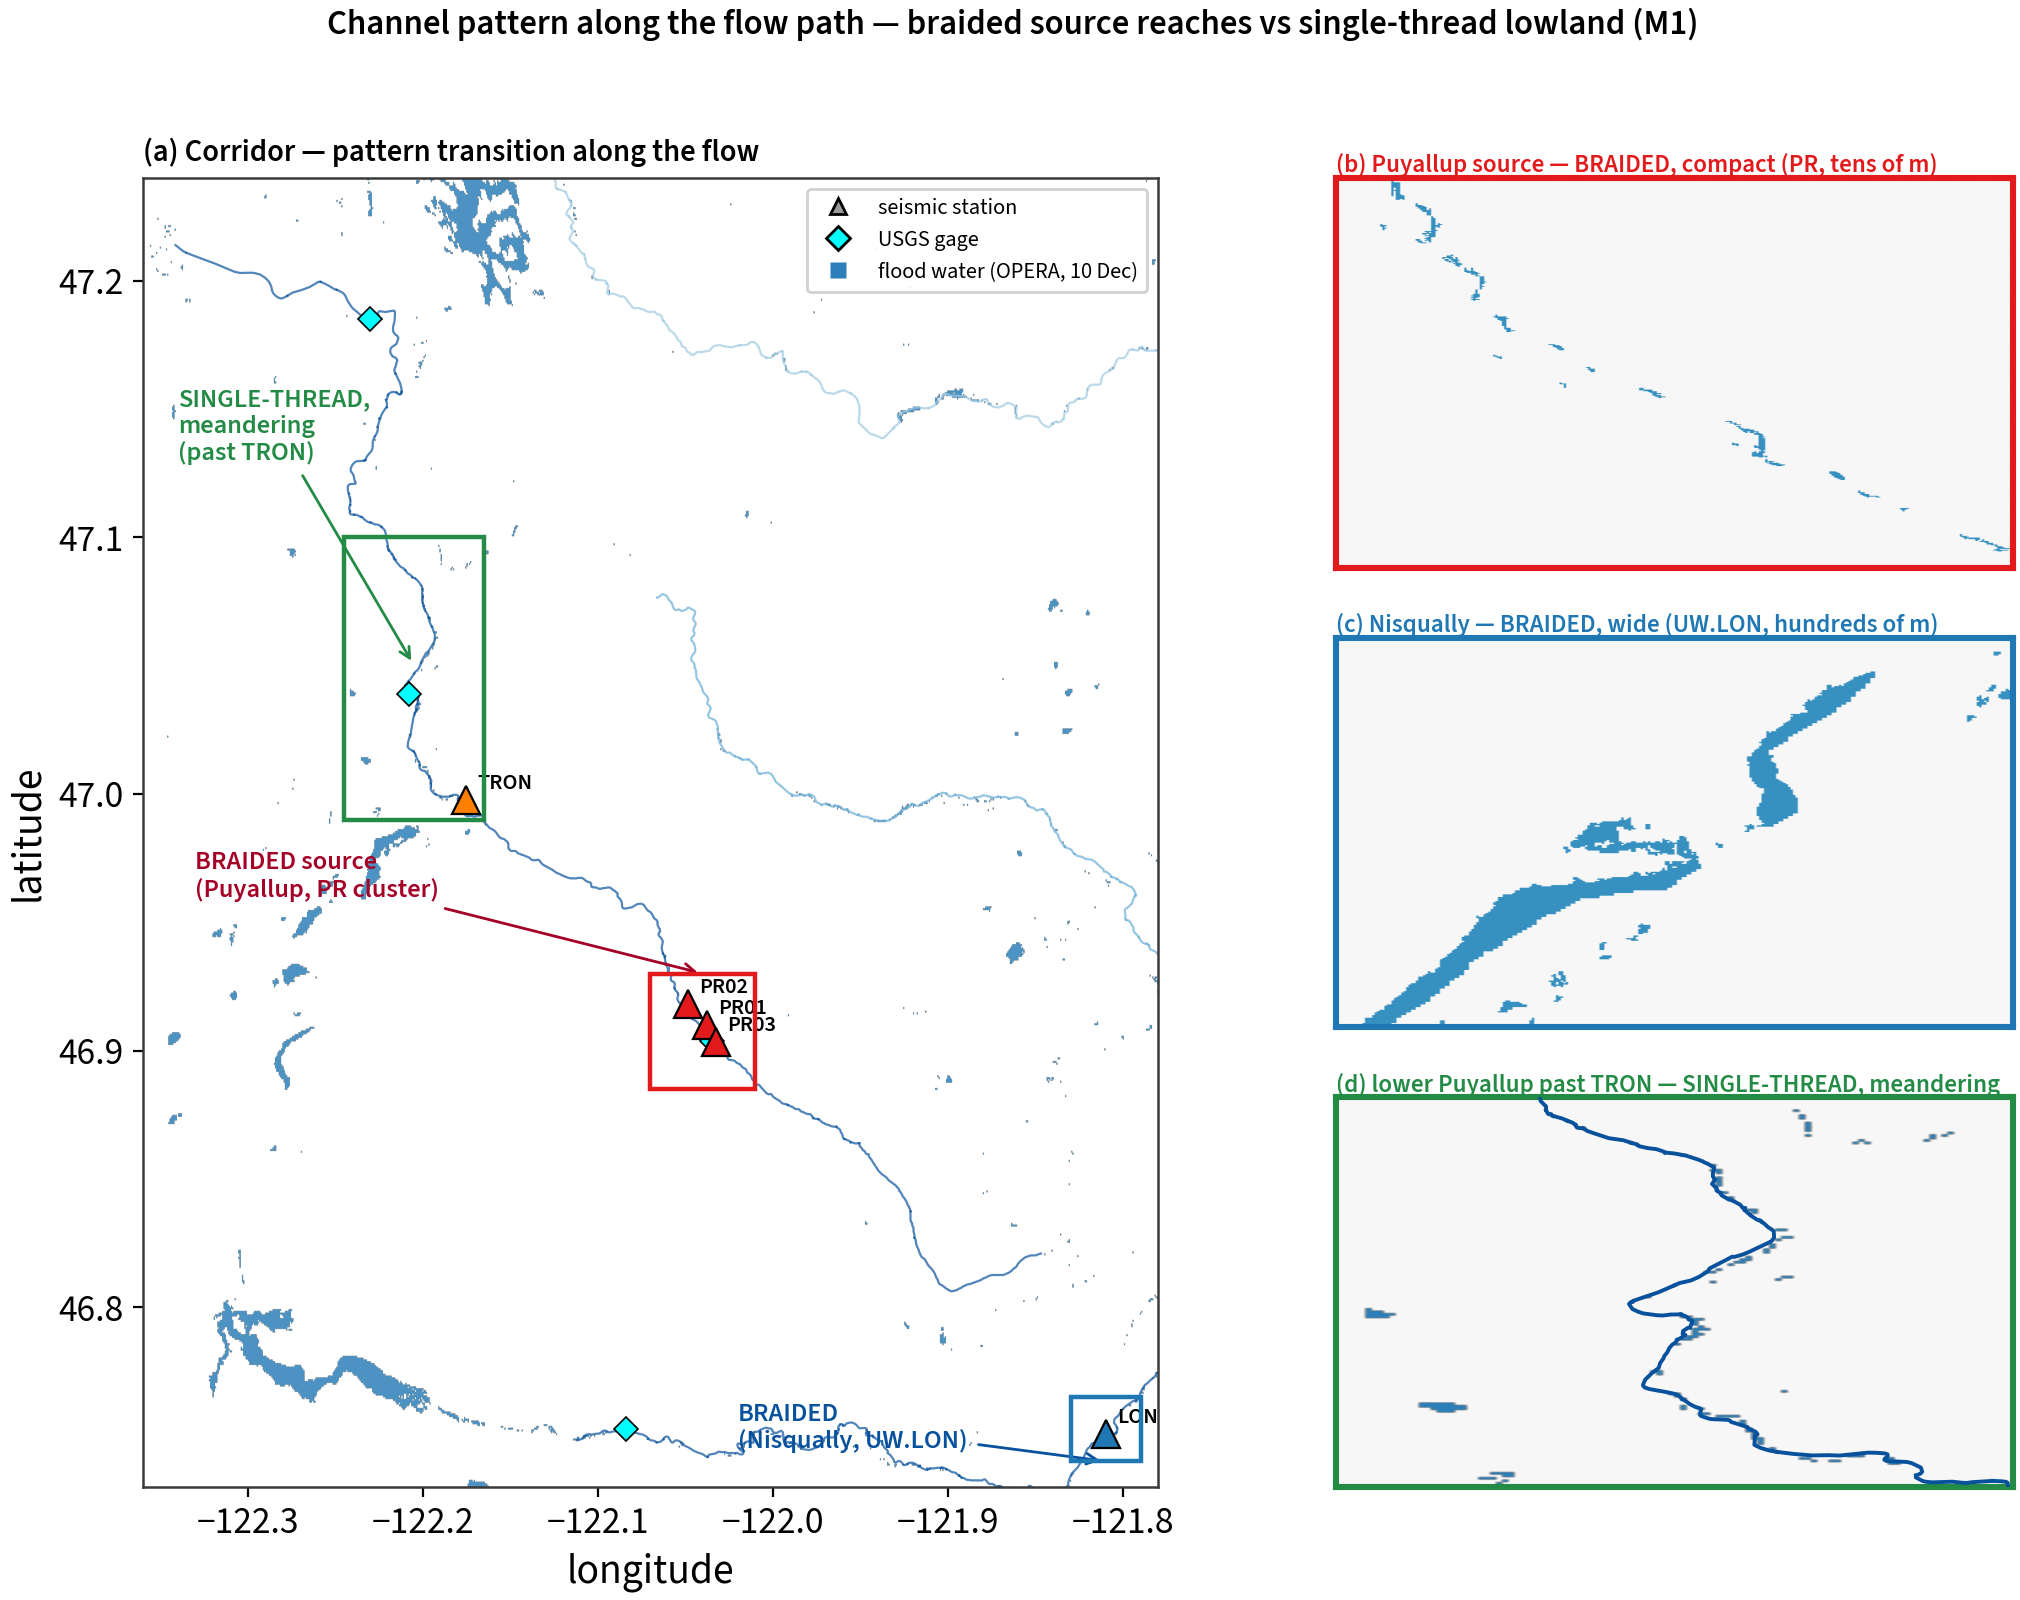
@fig-pattern |
fig27_channel_pattern.png | Channel-pattern map (M1): braided source (PR compact, UW.LON wide) → single-thread meandering lower Puyallup past TRON (OPERA water + Sentinel + NHD) |
@fig-traffic |
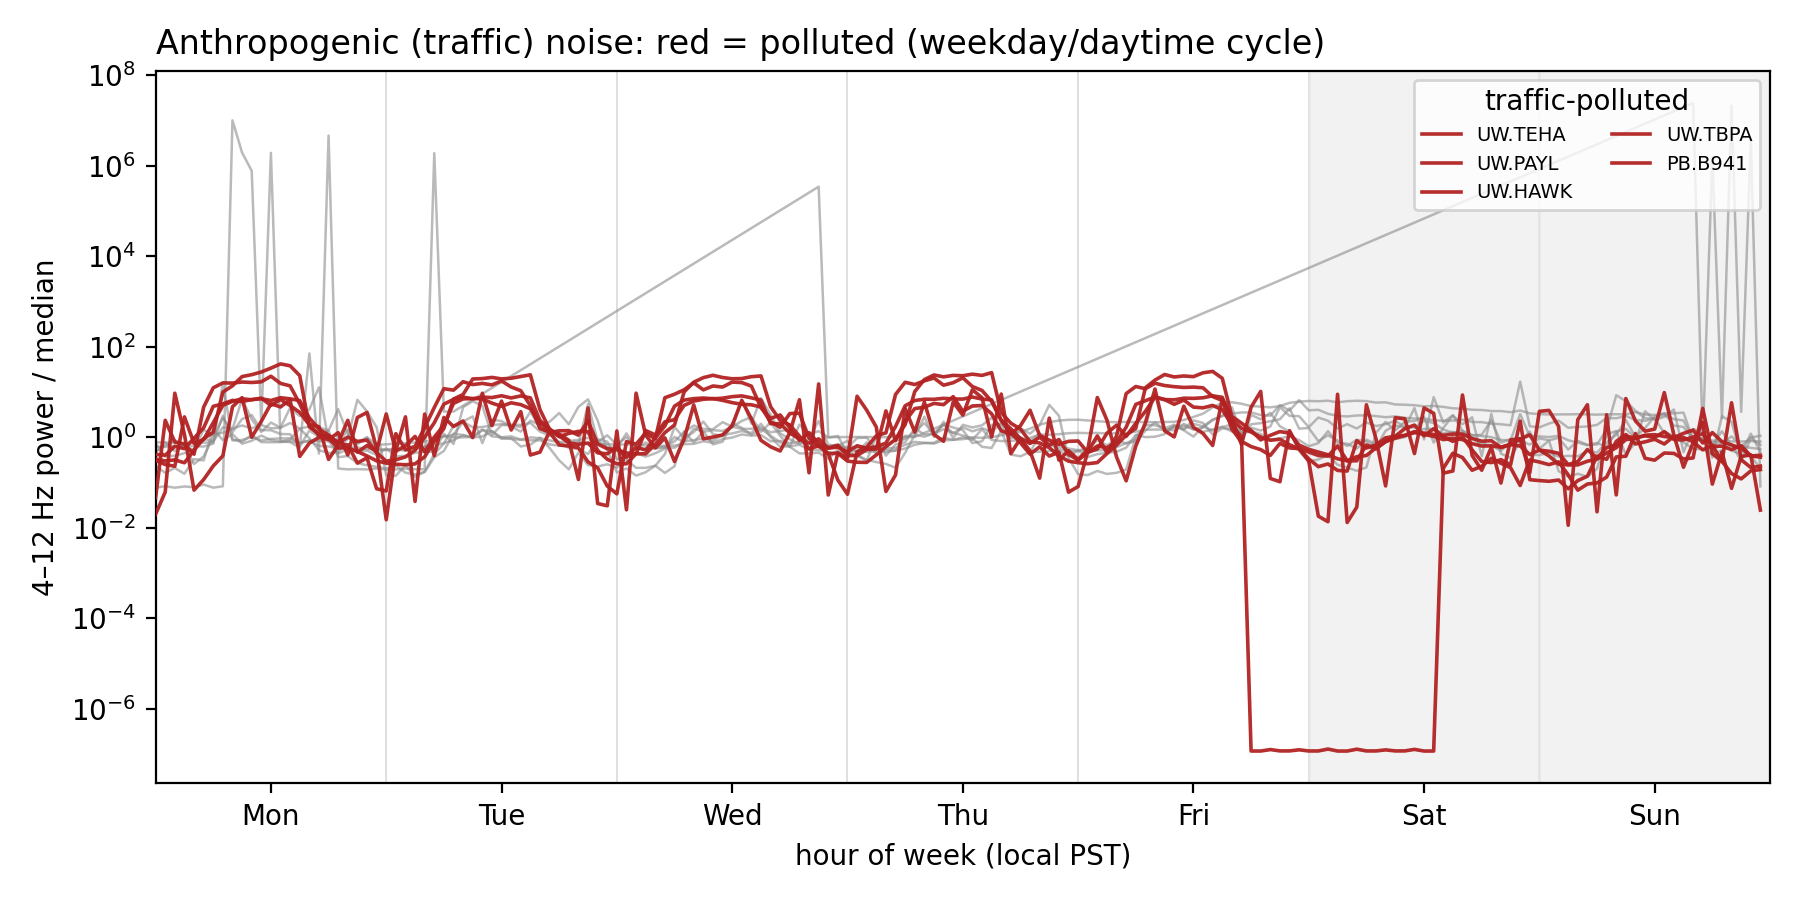
figS_traffic_noise.png | Traffic-noise contamination control (supplement) |
@fig-vq |
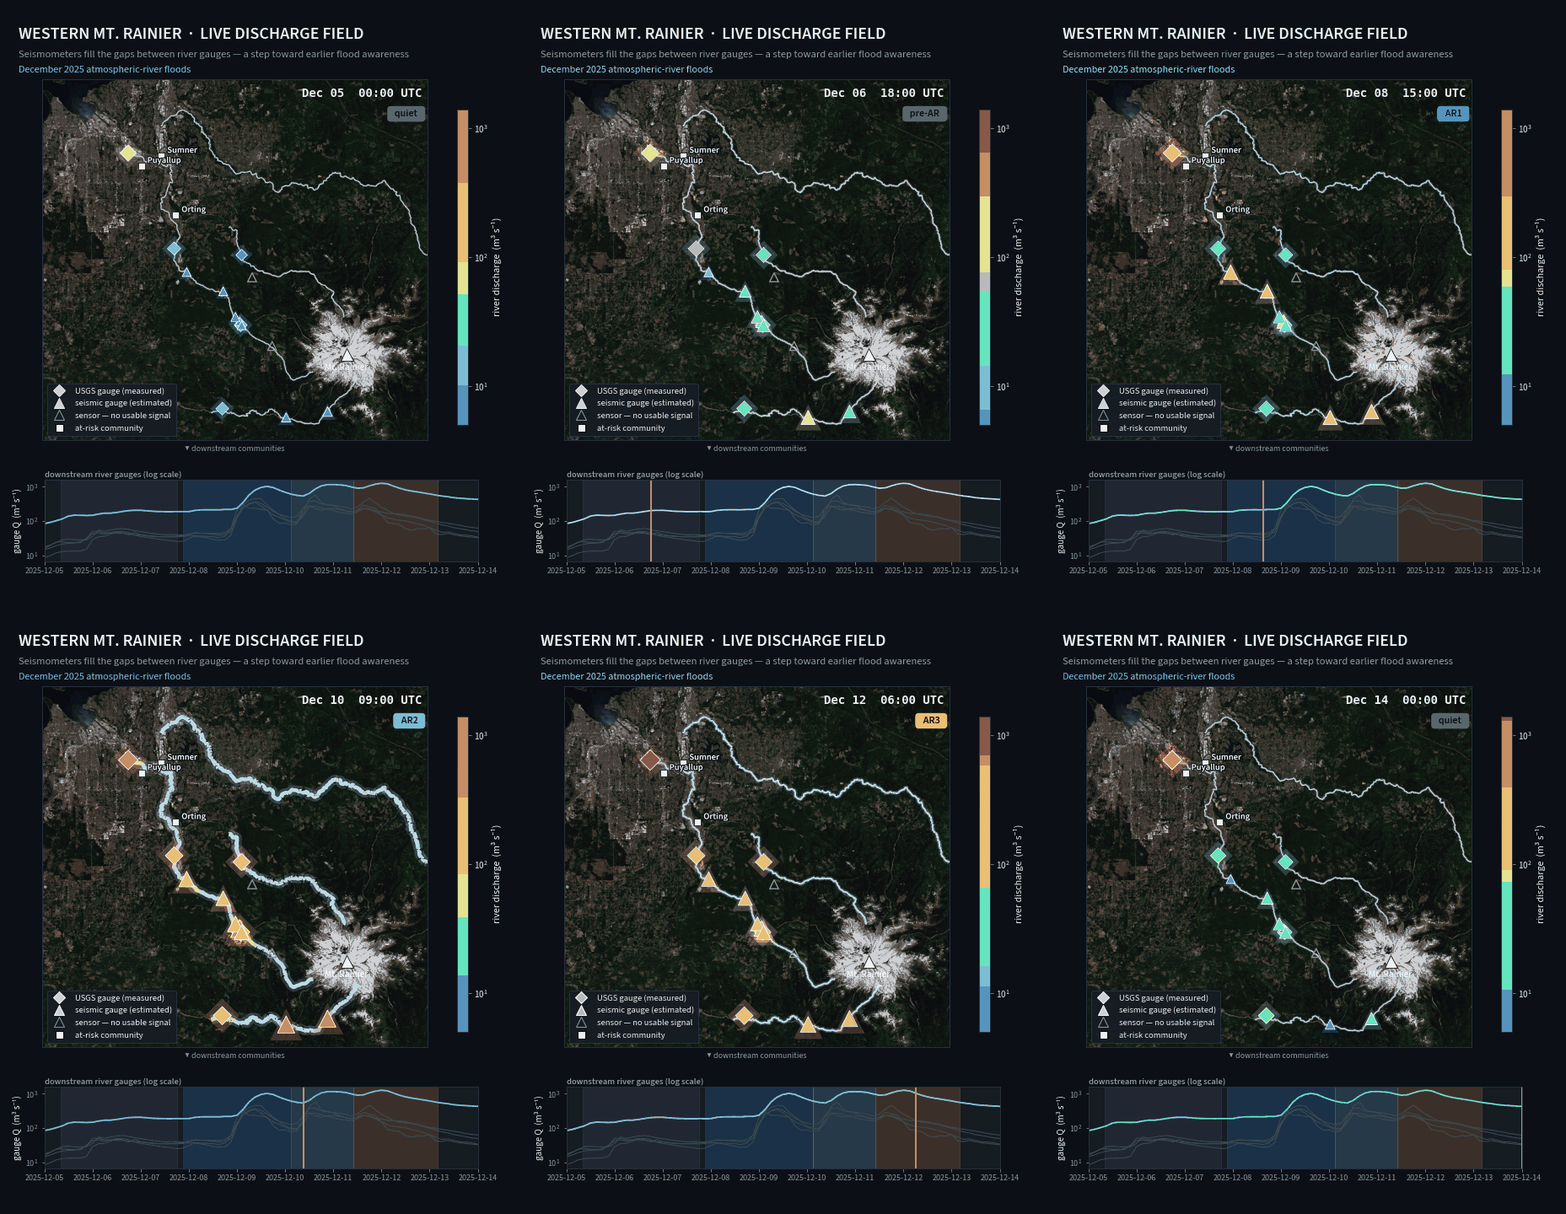
virtual_q_animation.gif | Embedded GIF: space–time distributed discharge field |
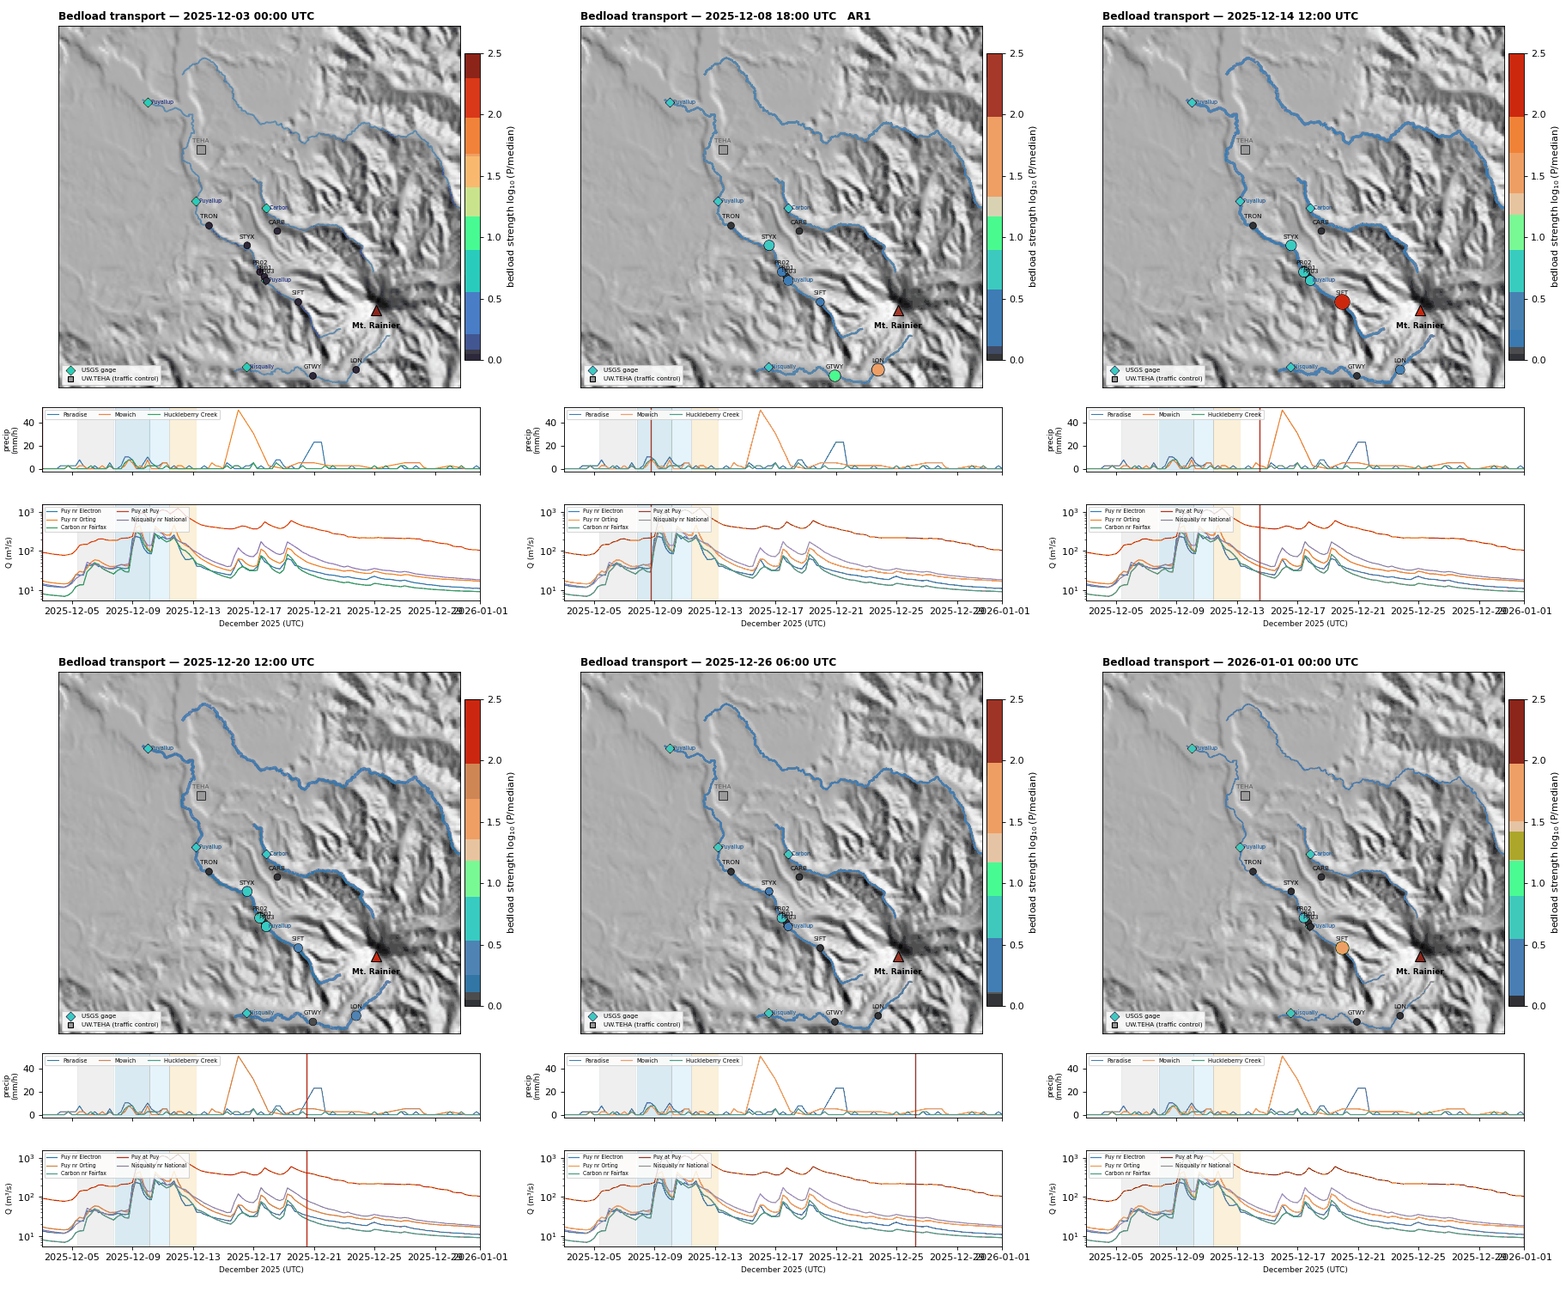
| — | bedload_animation.gif | Repo-only multidisciplinary GIF (SNOTEL + gage + bedload) |
3.2 The threads
Each thread: Claim · Evidence (figs) · Key assumptions · Strength · What would close the gap.
3.2.1 T1 — Seismic→discharge scaling is the calibration backbone (turbulence)
- Claim: 5–15 Hz seismic power follows a stable power law P ∝ Q^b, b≈1.4–1.7, consistent with the Gimbert (2014) turbulent-flow prediction (not 5/4; baseline ~0.9–1.4).
- Evidence:
@fig-scaling,@fig-scatter,@fig-ts. - Assumptions: single-thread line source at fixed r; response removal valid; lag constant; turbulence (not bedload) dominates the band.
- Strength: Strong / foundational. r up to 0.94. Everything else rests on this.
- Gap: baseline b uncertain (1.0 vs 1.4); confounded with attenuation geometry.
3.2.2 T2 — Multi-river generalization (two basins, not one reach)
- Claim: The method works in a second independent basin — Nisqually (CC.GTWY r=0.89, UW.LON r=0.91, steepest b≈2.2) — not just the Puyallup.
- Evidence:
@fig-scaling,@fig-map,@fig-vqval. - Assumptions: cross-basin comparability of gages and station geometry.
- Strength: Strong & undersold. Generalization is a genuine novelty vs single-reach prior work.
- Gap: only 2 basins; CC networks for other western drainages downloaded but not all analyzed.
3.2.3 T3 — Time-dependent bedload across the ARs (bounded hypothesis)
- Claim: 5–15 Hz excess power peaks in AR2 (≈110–180× background near source), 3× AR1/AR3, despite AR2 not being the largest discharge → progressive de-armoring / cross-pulse supply effect; b(t) rises above baseline during AR1–AR2.
- Evidence:
@fig-bltime,@fig-bl,@fig-bt,bedload_animation.gif. - Assumptions: the 5–15 Hz band carries bedload at all — directly contradicted by T4. Excess-over-baseline is bedload, not roughness/stage-geometry change.
- Strength: Weak as literal bedload; strong as phenomenology. The AR2 anomaly is real and interesting whatever its cause.
- Gap: no access to the canonical 30–80 Hz band at the stations that see the river (T4). Needs ground truth.
3.2.4 T4 — Are we even sampling the right frequencies? (the honesty thread)
- Claim: No station both reaches the bedload band (30–80 Hz) and senses the river: 50-sps CC stations cap at 25 Hz (turbulence only); the one 200-sps lowland station is too far/urban. Grain size is amplitude-coded (∝D³), not band-coded below ~100 Hz. Bedload is therefore a frequency-bounded hypothesis.
- Evidence:
@fig-spec,@fig-edge. - Assumptions: PNW attenuation; Hertzian contact-corner scaling; UW.LON 30–50 Hz edge is tentative.
- Strength: Strong & important. This is the rigor that reframes the whole paper turbulence-led.
- Gap: the 2026 CH (500 sps) archive would settle it — not available via FDSN for 2025.
3.2.5 T5 — Two-regime scaling: the P–Q break and what it means (UPGRADED)
- Claim: An AIC/BIC test (autocorrelation-corrected n_\text{eff}) finds a significant break at 5 of 8 river stations — four steepen (PR01 ΔBIC≈159, TRON, GTWY 0.7→3.5, UW.LON 1.1→5.0), STYX flattens (3.0→1.3); PR03/PR02 are clean single laws. The break is a fluvial regime transition (entrainment / geometric anabranch / overbank / H^7/3 suppression), not necessarily a bedload onset.
- Evidence:
@fig-thr(two exponents + ΔBIC),@fig-scaling(★ break markers), discriminated by@fig-braid(hysteresis) +@fig-braidsat(satellite). - Assumptions: broken-stick is the right two-regime form; n_\text{eff} from lag-1 residual autocorrelation is adequate.
- Strength: Strong & now the candidate spine (with T9). Was “medium, undermined”; the BIC rigor + mechanism-discrimination framework upgrades it from a vulnerable “transport onset” claim into a network-scale diagnostic.
- Gap: mechanism is satellite-confirmed only at PR01; the steep Nisqually (UW.LON) break needs its own SAR test (workflow 19
--region nisqually, pending PC API); out-of-sample March-2026.
3.2.6 T6 — Attenuation correction (PNW Q)
- Claim: Using PNW-inferred Q(f)=Q0 f^η (Q0≈25, η≈0.5 → Q(10Hz)≈74–80) gives e-folding r_e≈780 m, far larger than Tsai’s Q=20 (210 m) — sets how far a station “sees.”
- Evidence:
@fig-atten. - Assumptions: regional Q applies to the Rainier edifice; single-scattering geometric spreading.
- Strength: Medium / supporting. Enables the detectability map (T11) and the braided-source argument (T9).
- Gap: Q not calibrated locally; no site terms.
3.2.7 T7 — Seismic virtual discharge & the distributed nowcast map
- Claim: Each clean station is a virtual gage (Q_seis = 10^((logP−a)/b)); combining gages + virtual gages yields a space–time discharge field — distributed, gap-tolerant streamflow monitoring of an ungaged basin.
- Evidence:
@fig-vqval(PR03/PR02 NSE 0.88/0.86),@fig-vq(the embedded GIF). - Assumptions: rating stable & transferable in time. T9 flags braided-reach drift (PR01 NSE 0.70).
- Strength: Strong & marketable. The “seismic network = distributed gage array” message is the most novel application angle.
- Gap: cross-event transfer (March 2026 out-of-sample test pending).
3.2.8 T8 — Downstream early warning (lead time + amplitude)
- Claim: Upstream seismic/stage lead the downstream flood-peak stage by ~36 h; downstream amplitude ~4× upstream → a seismic early-warning role for the undammed, lahar-prone corridor. Answers “why did downstream rise each AR but not upstream/seismic” (local sensing + basin wetting + tributary superposition).
- Evidence:
@fig-ew,@fig-ts. - Assumptions: lead time generalizes beyond this one compound event.
- Strength: Strong & high-impact (hazard angle). But n=1 event.
- Gap: needs the March-2026 (and ideally more) events to show the lead is robust, not coincidental.
3.2.9 T9 — Braided-reach: a distributed, non-stationary source (NEW)
- Claim: The Puyallup source cluster sits on an aggrading glacial-outwash braidplain. The single-thread model fails: distributed source, nonlinear stage-partitioning, H^7/3 suppression/flattening, avulsion. PR01’s “cleanest Qc” is geometric (reversible loops, |HI|≤0.06, no supply decay), not bedload; a coherent +0.2-log baseline drift AR1→AR3 across all 3 stations = channel migration.
- Evidence:
@fig-braid, supported by@fig-thr,@fig-scaling,@fig-vqval.@fig-braidsat: Sentinel-2/-1 pre/post (Nov→Jan) confirms the avulsion prediction directionally — PR01’s nearest active thread moved ~50 m closer and PR01 shows the largest predicted geometric drift (median Δlog₁₀P≈+0.28), matching the observed +0.2-log cross-AR drift in sign and rank. - Assumptions: baseline drift is geometric, not a basin-supply trend; Lawler HI captures the relevant loop sense.
- Strength: Strong & differentiating. Recasts T3/T5 and warns T7 — a caution most of the (single-thread) literature has not had to make. Now satellite-corroborated.
- Gap: the satellite magnitude is threshold-sensitive at 10 m (sign/order robust, magnitude not) — a ≈3 m or a December time-series (per-AR) test would calibrate it; whether it generalizes to other braided reaches.
3.2.10 T13 — Warm-AR thermal control (rain-on-snow vs cold snow accumulation) (NEW)
- Claim: The floods were flood-productive because the ARs were warm: at high-elevation SNOTEL (Paradise 1563 m, Mowich) the AR pulses sat near/above the 0 °C freezing line → rain on snow, while late December dropped to −9.6 °C and precipitation accumulated as snow (Paradise SWE ≈8→26 cm) and produced little runoff. The flood-generating window is thermally defined.
- Evidence:
@fig-warmsnow(SNOTEL temperature + SWE), the post-flood quiet tail in@fig-ts/@fig-bltime. - Assumptions: Paradise/Mowich represent the freezing level over the drainage tops.
- Strength: Strong as framing. Explains why the seismic–discharge coupling is evaluated over the warm-AR window (the flood-window fit decision) and why late-Dec quiet is a different regime — ties the meteorology to the scaling analysis.
- Gap: two stations; a freezing-level/rain-snow-line product would generalize it.
3.2.11 T10 — The December-2025 compound AR event itself (the narrative spine)
- Claim: A weak pre-AR primed the basin, then three strong pulses; upstream stayed flat while downstream rose monotonically (cumulative wetting + rising freezing level + tributary superposition).
- Evidence:
@fig-map(OPERA flood extent),@fig-ts,@fig-ew,@fig-bltime. - Assumptions: AR window definitions; gage representativeness.
- Strength: Strong as connective tissue. This is the “dramatic event” container the braided thread (and all others) belong to.
- Gap: the event is the case study; not a standalone scientific claim.
3.2.12 T11 — Detectability map: where river seismology works (and doesn’t)
- Claim: Of 13 stations, 6 usable (r≥0.7), 2 marginal, 3 no-signal; hollow triangles document where it failed — itself a deployment guide.
- Evidence:
@fig-map,@fig-scaling,@fig-traffic(traffic-contaminated controls). - Assumptions: r-threshold classification; one event’s classification generalizes.
- Strength: Medium / valuable methods contribution. Honest negative results.
- Gap: depends on station siting; sample of one network.
3.2.13 T12 — Future capability: rising CC sample rates / 500-sps CH
- Claim: CC channels are increasing sample rate (some 500 sps as of 2026) → future multi-sensor flood + sediment monitoring; a direct 30–80 Hz bedload test becomes possible.
- Evidence: station table in
@fig-map/config;@fig-edgeas the best 2025 proxy. - Assumptions: 500-sps archives will be retained and river-proximal.
- Strength: Forward-looking / discussion only. Not a 2025 result.
- Gap: 2026 CH data (Bradley/CVO route); March-2026 high-rate check.
3.3 Candidate main stories (pick one spine)
After the two-basin reorganization-timing result, the flood-wave lag correction, and the domain-of-applicability analysis (REVIEW_2026 §8–§10; tags REORG-2BASIN-2026-06-25, FIGS-OFFLINE-2026-06-25), the spine is locked to the dynamics-led story:
“Watching a braided river rearrange itself during a flood — and where seismics can.” Seismic power resolves when the active braid reorganizes (it lags peak Q, is recession-driven and stepwise) — a timing gages and before/after satellites cannot give — and the two-basin contrast defines the method’s domain (clean at the compact, co-located-gage Puyallup; confounded at the wide, far-gaged, snow-dominated Nisqually).
This supersedes the earlier “Option A first” and is the dynamics evolution of Option B (rigor-led), now with a positive headline result rather than only limits. It is REVIEW_2026 §10c Spine 1. The open gap is real: Gangemi et al. (2026, Tagliamento — braided) declines a braided source model; Shakti & Sawazaki (2021) saturates the virtual-gage concept but not the dynamics. Journal: JGR-ES.
Thread disposition (all 13 ship — main vs supplement): - Main spine: T9 (braided source-model breakdown) · reorg-timing (NEW, @fig-reorg) · T5 (two-regime break = the static signature) · the two-basin domain result (@fig-domain, the lag + width + elevation contrast) · T4 (frequency rigor, as the bounding caveat). - Framing / payoff (main text, supporting): T1 (scaling backbone) · T2 (two basins, now the domain contrast) · T7 (virtual-Q field, the legibility device) · T8 (~36 h early warning, the applied payoff) · T10 (the event container) · T13 (warm-AR rain→snow, now also the supply-shutoff confound). - Supplement: T3 (time-dependent bedload, bounded) · T6 (attenuation) · T11 (detectability) · T12 (future high-rate).
New figures vs the old inventory: @fig-reorg = fig22 (reorg timing, ×2 basins, lag-corrected); @fig-domain = fig23. fig3/fig4 are now lag-corrected for the far-gage Nisqually stations (slope b is lag-insensitive, Δb<0.05 — within CI — so fig2/threshold breaks are unchanged; only the hysteresis loop shape needed correction).
Option A — “A seismic network is a distributed gage array” (application-led). Spine: T1→T2→T7→T8, with T11 as method and T4/T9 as honest caveats. Sells the virtual-discharge map + early warning as the headline capability for an ungaged hazard basin. Strongest, most novel, most fundable. Figures: map, scaling, virtual-Q GIF, early warning, rating.
Option B — “What river seismology can and cannot do on a glacial braidplain” (rigor-led). Spine: T4→T9→T5→T11. Headline = the frequency-sampling and braided-source limits that bound bedload claims; turns the negative results and braided thread into the contribution. Most defensible, most original physically. Figures: spectra, braided diagnostic, threshold, detectability map.
Option C — “The December-2025 ARs seen seismically” (event/hazard-led). Spine: T10 as container, hanging T1/T3/T8 off it. A case-study narrative of a dramatic compound event. Most accessible, least novel methodologically. Figures: map+OPERA, timeseries, bedload-time, early warning.
3.3.1 Recommended spine — updated by the June-2026 literature survey
A targeted 2023–2026 literature survey (deep-research, 16 sources, 25 claims adversarially verified) overturns the earlier “lead with A” recommendation. The distributed virtual-gage idea (A) turns out to be the most saturated of the four: Shakti P.C. & Sawazaki (2021, Prog. Earth Planet. Sci.) already established seismic noise as a virtual gage for ungauged basins (power law Q=A(E-E_0)^b, validated on Typhoon Hagibis 2019), so our novelty there is only network density, not the concept. DAS distributed sensing is taken (Roth et al. 2025); seismic flood early-warning is Science/Nature-tier territory (Cook et al. 2021 Chamoli; Eibl et al. 2020 jökulhlaups, >20 h lead). The genuinely open gap — published by no 2023–2026 paper in the surveyed corpus — is the one this session’s satellite work created:
Single-thread fluvial-seismology source-model breakdown in a braided glacial-outwash reach, diagnosed jointly by (a) hysteresis reversibility, (b) a cross-flood baseline drift, and (c) independent Sentinel-2/-1 channel-migration imagery showing the active braid moved toward the most anomalous station.
The closest competitor, Gangemi et al. (2026, Tagliamento — itself a braided river), applies the canonical single-thread Tsai/Gimbert framework only qualitatively and explicitly declines to develop a braided source model — it leaves this gap open. JGR-ES specifically rewards process / source-model / geomorphic-coupling advances (vs GRL brevity, Seismica methods, WRR hydrology), so this is also the best journal fit.
New recommended spine (T9-led): lead with the braided-reach source-model breakdown (T9 + @fig-braid/@fig-braidsat), use the distributed virtual-gage field (T1/T2/T7) as the network-scale framing device that makes the anomaly legible, deploy the frequency/Nyquist limit (T4) as a bounding caveat (state it grain-size-conditional — in some systems bedload sits at 5–15 Hz, below the 25 Hz Nyquist), and keep the ~36 h lead (T8) as the applied payoff. T3/T5/T6 and all technical tests move to supplementary. The braided thread is no longer a “credibility hinge” for someone else’s headline — it is the headline.
3.4 June-2026 re-evaluation (after the NWIS / flood-window / two-regime work)
What changed this session, and how it moves the spine.
New evidence since the survey. (1) Complete NWIS discharge to 12/31 — peaks corrected (Electron 323, Nisqually 425, Puyallup@Puy 1257), and the virtual-gage rating improved (NSE PR03/PR02 0.95/0.92 vs the old 0.88/0.86). (2) Entire-month robust fits — every single-value metric is now computed over the whole December record (flood AND post-flood low-runoff quiet) at every station, so all stations are treated identically and the flood vs. no-flood regimes can be contrasted (superseding the earlier flood-window-only decision; the qualitative story is unchanged but every number is now authoritative and consistent). (3) NEW — two-regime breaks across the network: an AIC/BIC test (with an autocorrelation-corrected effective n) finds a statistically significant P–Q break at 5 of 8 river stations — four steepen (CC.PR01 ΔBIC≈159, CC.TRON, and the two Nisqually stations CC.GTWY 0.7→3.5 and UW.LON 1.1→5.0, the steepest in the network) and CC.STYX flattens (3.0→1.3); the clean source anchors CC.PR03/PR02 do not break. (4) NEW — grain-size/process-conditional bedload band (boulders, large wood, debris-flow surges radiate to ~2 Hz). (5) NEW — warm-AR thermal control (SNOTEL: rain-on-snow flood window vs cold late-Dec snow accumulation; new thread T13). (6) Satellite braided test (@fig-braidsat, directional).
Physics re-evaluation — a two-level picture. 1. Backbone (unchanged, robust): band-limited seismic power tracks turbulent flow, hence discharge: P\propto Q^{b}, b\approx1.4–1.8 at clean source stations (near Gimbert 2014). 2. The new physics — the break: above a critical discharge Q_c the scaling changes regime, and the sign+mechanism of that change is the contribution. A steepening break admits three non-exclusive mechanisms — bed-mechanical entrainment (excess Shields stress), geometric / anabranch activation (a broad, close, or newly-wetted braided thread switches on without the bed mobilizing), or an overbank transition; a flattening break (STYX) is hydraulic-geometry suppression (P\propto H^{7/3} falls as a given Q spreads over a wider, shallower section). Crucially, the break is not necessarily a bedload onset — the reading the bedload-seismology literature reflexively applies — and we can discriminate geometric from bed-mechanical with two tools that literature lacks: hysteresis reversibility and satellite channel-change. The braided Puyallup source (PR01) is the satellite-confirmed geometric end-member. 3. Bounds: the resolvable ≤25 Hz band is turbulence-dominated; the canonical 30–80 Hz bedload band is unsampled, though coarse boulder/wood/debris transport leaks into 1–15 Hz (degenerate with turbulence). Attenuation gives r_e\approx 780 m (bedload recoverable only ≲1 km).
Re-evaluated spine — generalize the braided breakdown to a network diagnostic. The survey’s “braided source-model breakdown” is correct but too narrow: it is one reach. The two-regime-break result lets us tell the same story at network scale and with a sharper, more general thesis:
The seismic power–discharge scaling breaks at a critical discharge across a glacial-river network, but the break diagnoses a fluvial regime transition — bed-mechanical entrainment, geometric/braided channel reorganization, or hydraulic-geometry suppression — not (necessarily) the “bedload onset” the field routinely infers. Seismic hysteresis and satellite channel-change tell them apart; the braided Puyallup source is the satellite-confirmed geometric end-member, the steep Nisqually (UW.LON) and the flattening STYX are contrasting regimes.
This subsumes T5 (threshold) + T9 (braided) and generalizes across T2 (two basins); it keeps T1 as the backbone, T4 as the bounding caveat, T7 as the network platform, T8 as the payoff, and T13 (warm-AR) as the framing of why the flood window is the evaluation period. It is more novel than the narrow braided spine (a network-wide, multi-mechanism discrimination framework, not a single anomaly) and it directly corrects a routine over-claim in the field — a high-impact, JGR-ES-shaped contribution.
Spine in one line: “Where, when, and why the seismic–discharge scaling breaks — a network diagnostic that separates geometric channel reorganization from bed-mechanical transport on Mt. Rainier’s glacial rivers.”
Survey caveats to resolve before drafting: (i) several “the single-thread model is known to break down” claims were refuted in verification — the breakdown is novel precisely because it is not established, so we must argue it rigorously, not cite it as accepted; (ii) confirm Luong et al. (2024/2026) and Nicoletti (2026) do not pre-empt the braided framing; (iii) targeted preprint search (EGUsphere/ESurf/ ESSOAr) for any unindexed seismic+Sentinel braided-river competitor — this is the load-bearing novelty claim; (iv) pin where Rainier glacial-outwash bedload sits vs 25 Hz Nyquist — resolved (June 2026): grain-size/process-conditional. Clean-gravel saltation impacts stay >100 Hz (even metre boulders ~140–300 Hz) → unsampled at 50 sps; but coarse boulder rolling/sliding, large wood (forested Cascade catchments), and debris-flow/lahar surges (Tahoma/Kautz/Nisqually/upper-Puyallup) radiate to ~2 Hz → the coarse-transport band extends into the resolvable 1–15 Hz window and is partly sampled, though degenerate with turbulence. Written into §Results (frequency evidence) + Limitations; reinforces the braided/coarse-source spine.
Open dependencies that could shift the choice: March-2026 out-of-sample (tests T5, T7, T8 robustness); PlanetScope pre/post (confirms T9 avulsion) — done via Sentinel-2/-1 (@fig-braidsat), directionally confirmed; 2026 CH 500-sps (could promote T3/T12 from hypothesis to result).