Volcanoes are monitored for eruptions. Mount Rainier has not erupted in living memory, and the monitoring built around that question misses most of what the mountain does to the people below it.
In an ordinary year Rainier produces earthquakes on a fault system beside the edifice, swarms of small events within it, ice that sticks and releases at the glacier bed, rock and serac falls from the upper walls, snow avalanches on the flanks, debris flows that run down valleys toward towns, and shallow landslides after prolonged rain. Each of these is usually studied by a different community, with different instruments, and reported in a different catalogue. They share a mountain, a water budget, and in several cases a trigger. That is the argument for treating them as one system.
Eight processes
Tectonic earthquakes. The West Rainier Seismic Zone sits beside the edifice and produces the region’s ordinary earthquakes. It matters here twice over: it is the background against which anything volcanic has to be distinguished, and strong shaking is itself a trigger for the slope failures below.
Volcano-tectonic swarms. Rainier produced a swarm in 2009, for which fluid-triggered slip was the favoured explanation Shelly et al., 2013, and another in July 2025. In both cases the evidence points away from magma on the move. The working interpretation is hydrothermal, and it has a long pedigree here: seismic and geochemical observations were assembled into a model of the magmatic–hydrothermal system a quarter of a century ago Moran et al., 2000. Pressurised fluid within the edifice redistributes stress without any magma moving. That reading has a consequence worth stating plainly. If the fluid system responds to seasonal water and heat, then a swarm is partly a hydrological event, and the mountain’s seismicity is coupled to its climate.
Glacier stick–slip. Ice at the bed sticks and releases, producing repeating events with a strong seasonal rhythm. Rainier is one of the places this was first characterised: swarms of thousands of near-identical shallow events beneath an alpine glacier, correlated with storms rather than with anything volcanic Thelen et al., 2013. The mechanism — basal stick–slip — has since been documented directly beneath other glaciers Helmstetter et al., 2015, and the surface expression at Rainier has been measured independently by terrestrial radar, which resolved both seasonal and diurnal changes in glacier velocity Allstadt et al., 2015. The source is repeatable and its location roughly fixed, which makes these among the most useful signals on the mountain: a natural, recurring source against which instruments and methods can be checked.
Rockfall and serac fall. Failures from the upper walls, including the confirmed Willis Wall serac fall of 28 May 2023. They are frequently recorded seismically and only sometimes seen directly, which is exactly the situation where ground truth is scarce and worth chasing. The reason to chase it is that a seismogram carries more than a detection: inverting long-period waveforms for the force a sliding mass exerts on the ground recovers its trajectory, its speed and its mass, as was done for the 2010 Mount Meager landslide Allstadt, 2013.
Snow and rock avalanche. Flank failures through winter and spring: a confirmed avalanche on the Carbon Glacier on 9 April 2020, a large south-west avalanche on 10 December 2023. Where a park report or a photograph exists, the event becomes a labelled example, and labelled examples are what constrain everything downstream.
Debris flows and lahars. Valley-confined flows carrying sediment away from the mountain, along drainages that lead toward the Orting–Puyallup corridor. Many begin in the proglacial gullies exposed by retreating ice, where steep, unconsolidated sediment meets concentrated runoff Legg et al., 2014. This is where the hazard stops being a scientific curiosity, because the same valleys carry the towns — and because the geological record sets the scale of what is possible. The Osceola Mudflow buried the Puget Lowland some 5,600 years ago Vallance & Scott, 1997, and tree rings from forest floors buried in the flow deposits date the largest lahar of the past millennium to 1507 Black et al., 2025. Neither required an eruption of the kind anyone is currently watching for.
Shallow, rain-triggered landslides. Failures on lower slopes after prolonged wetting. The classical description is an intensity–duration threshold on the triggering storm Guzzetti et al., 2008, and its well-known weakness is that the threshold is not stationary: the same storm produces failures in one month and nothing in another. This is where the soil-memory question the project is built on becomes concrete: whether a storm produces failures depends less on the storm than on the wetting history that preceded it.
Deep-seated landslides. This one is unresolved. Slow-moving deep failures are common in the Cascades, and they are detectable — satellite radar maps their displacement Mondini et al., 2021Handwerger et al., 2022, and ambient seismic noise has been used to track the water table inside one Voisin et al., 2016, which is the same physics the soil-memory work rests on. Whether Rainier has them, and whether they leave a signature the current network can detect, is a question the combined array should be able to answer.
Seven sensing systems
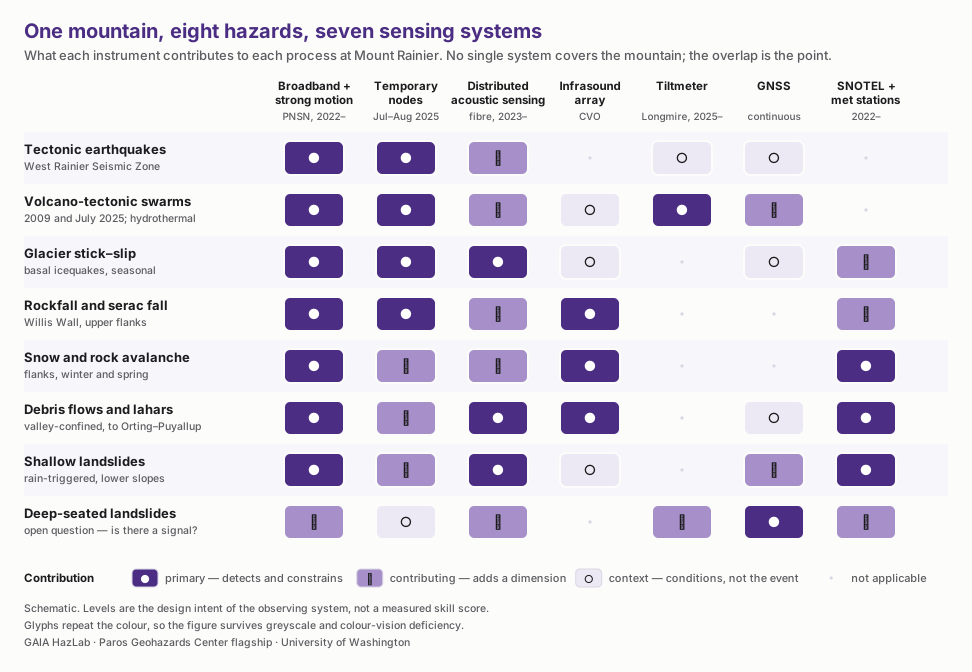
Figure 1:What each instrument contributes to each process. No single system covers the mountain; the overlap is the design.
Broadband seismometers and strong-motion sensors from the Pacific Northwest Seismic Network provide the permanent backbone: continuous, calibrated, and long enough to define what normal looks like. That backbone has grown recently — the Cascades Volcano Observatory expanded its geophysical network on the mountain specifically to improve volcano and lahar monitoring, adding seismic, infrasound, GNSS and web-camera sites Kramer et al., 2024. Much of what follows is possible because that expansion happened.
Temporary nodes deployed in July and August 2025, with Brandon Schmandt’s group at Rice University, densify the array for a season. Density buys resolution of location, of depth, and of structure that a permanent network spread across a mountain cannot deliver.
Distributed acoustic sensing turns an existing fibre-optic cable into thousands of strain channels along its length. Its geometry complements a station network: dense along a line, where a station network is sparse across an area. That suits a process that travels down a valley. In glaciated terrain the method has already been pushed past detection into quantification — a cable beside a glacier recovered meltwater discharge from the seismic noise the water itself generates Manos et al., 2024. A channel that can be read for discharge can, in principle, be read for what the channel is carrying.
An infrasound array, operated by the USGS Cascades Volcano Observatory, records the atmospheric pressure signal of mass movements. Some events are loud in air and quiet in the ground. Combining the two separates a surface flow from a buried source more cleanly than either does alone. Turning either into a discharge or a volume needs the ground itself calibrated, which is why the seismic properties of one Rainier river channel have been measured directly for use in debris-flow monitoring Conner et al., 2026: without knowing how the valley transmits energy, an amplitude is not a measurement of anything.
A tiltmeter at Longmire, streaming since 2025, measures ground deformation too slow for a seismometer to see.
GNSS provides continuous displacement, the reference against which any claim of deformation is tested.
SNOTEL and meteorological stations supply snow water equivalent, precipitation and temperature. These record the conditions that make a hazard likely. Without them the seismic catalogue is a list of events with no explanation attached.
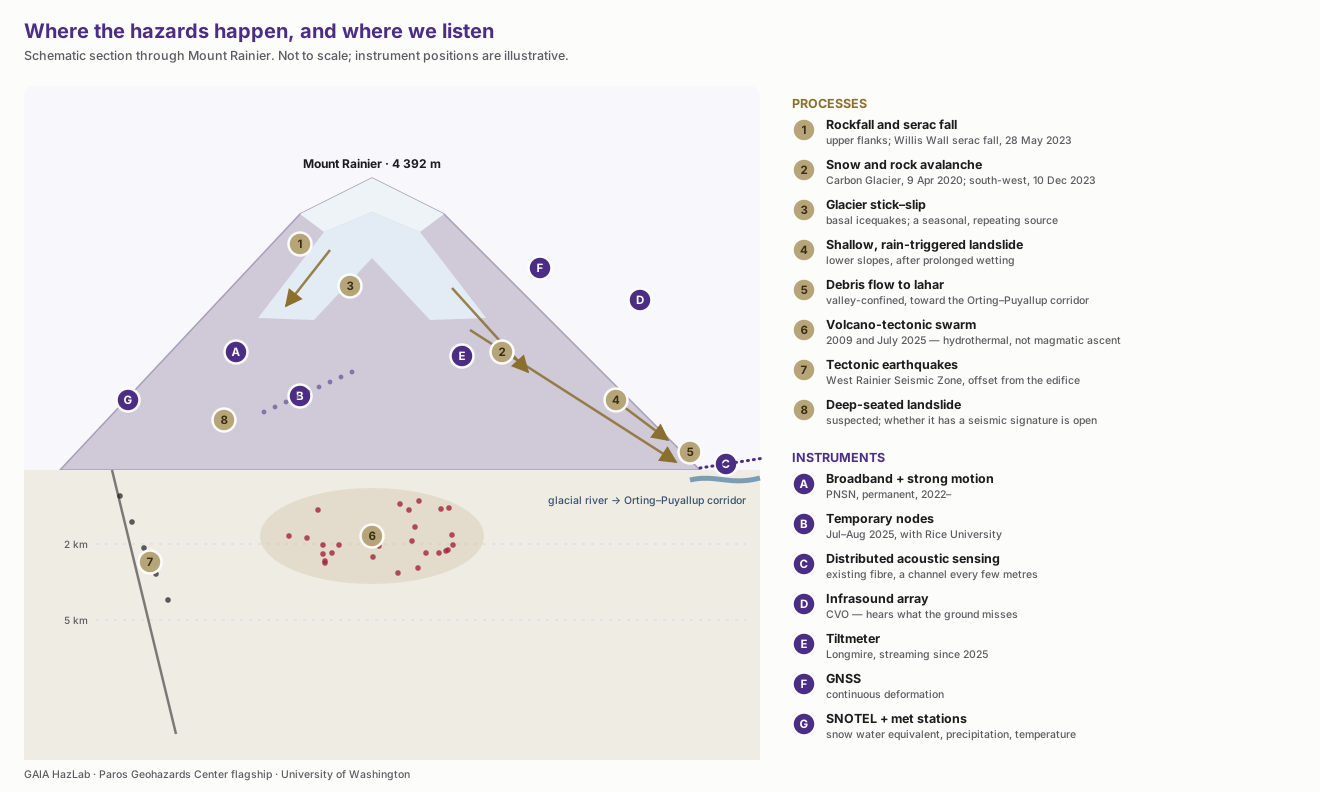
Figure 2:Where the processes happen and where the instruments sit. Schematic, not to scale.
What we are building
The work runs in three stages, and the first is unglamorous.
A catalogue that distinguishes event types. Detection, classification, location, size. The existing record depends heavily on what a network analyst happened to notice, which biases it toward large events and toward periods when someone was watching. Machine-learning detection applied uniformly across the archive removes that bias, and the difference between the two catalogues is itself a result.
Doing this needed labelled data before it needed a model. The curated Pacific Northwest AI-ready dataset assembled roughly 200,000 three-component waveforms from more than 70,000 events, including the surface events that most catalogues discard as noise Ni et al., 2023. Against it we tested what actually separates four source classes — earthquake, explosion, surface event, noise — and found that convolutional networks reading spectrograms outperform feature-based classifiers, with the resulting model, QuakeXNet, small enough (70,000 parameters) to process a day of continuous three-component data in seconds on ordinary hardware Kharita et al., 2026. Frugality is not incidental here. A model that runs cheaply is a model that can be run across fifteen years of archive rather than a promising subset.
Locations we can check. A buried earthquake has no ground truth. A surface event sometimes does: a park report, a photograph, a satellite image. Early locations from envelope cross-correlation with a uniform velocity model were not accurate enough when tested against those reports; ensemble deep-learning phase picking does better. That comparison is only possible because surface events are, occasionally, seen.
Characterisation beyond location. Source properties: kinematics, energy budget, how a flow evolves as it moves. This is where the sensor combinations pay. Infrasound constrains what is in the air, distributed acoustic sensing constrains what moves along the valley, the seismic network constrains the source, and the meteorological record constrains what set it up.
Code is developed in the open at
Denolle
A model of the mountain to locate against. Locations and source properties are only as good as the velocity model beneath them, and the regional models do not resolve the edifice, its glaciers or its altered core. rainier3d is an open, Python-built model of P- and S-wave speed, density and attenuation from the ground surface to 20 km below sea level. It extends the mapped geology to depth with explicit rules and a rock-physics law, keeps the long wavelengths of the USGS Cascadia velocity model, and is checked against Pacific Northwest Seismic Network travel times: its rock physics and a correction of the regional model are fitted to P and S−P times with every earthquake relocated in 3D. The same grid carries the surface layers that matter for hazards (glacier ice thickness, soil thickness, water-table depth, streams, vegetation and land cover), the hydrothermal alteration mapped from a helicopter electromagnetic survey, GNSS strain rates and the stress of the edifice load. How it was built, how well it fits, and how to download it are set out in the rainier3d data paper. The model’s surface layers can be explored with the seismic network and seismicity in the 3D viewer, built by Derek Yao.
What the Paros support has made possible
The Paros gift paid for the year in which several instruments and several people came into one frame of reference. It is the kind of year federal awards rarely cover, and everything below depends on it.
A person to hold the data together. Alex Rose, a UW Applied Physics Laboratory graduate, was hired on the flagship to bring the multi-modal record — seismic, infrasound, tilt, distributed acoustic sensing, nodes — into a single queryable form. Most of the science described above waits on that work, and no grant lists it as a deliverable.
Instruments online. The Longmire tiltmeter is streaming continuously, with the summer field record integrated alongside it. The July–August 2025 nodal deployment was completed and is being processed.
Students trained on the mountain. Graduate researchers are working on detection and classification of surface events with the Cascades Volcano Observatory, on cross-validating seismic locations against infrasound and satellite observations, and on turning seismometers into instruments that measure rain and subsurface wetting.
Methods that travel. The approach behind all of it is repurposing ordinary instruments to measure something they were not built for, and reading the continuous background wavefield rather than only the events picked out of it. Two recent results show the range. Twenty-two years of ambient wavefield at Mount St. Helens were reprocessed to separate what is volcanic from what is seasonal — the same separation problem Rainier poses, on a mountain with a longer record Köpfli et al., 2024. And a decade of continuous noise from Cascadia seafloor observatories, read for velocity change rather than for earthquakes, resolved pore-pressure transients and the fluid pathways they travel along, with William Wilcock, in Science Advances Kidiwela et al., 2026.
Neither study was about Rainier. Both are about the same move: the information is in the continuous record, not only in the catalogue.
Open questions
Is the July 2025 swarm driven by heat or by fluid transfer, and is glacier melt implicated?
Can subsurface wetting be recovered from seismic velocity change well enough to predict which slopes fail in a given storm?
What is the relationship between hydrothermal activity within the edifice and the West Rainier Seismic Zone beside it?
Does Rainier have deep-seated landslides, and do they leave a signature this network can see?
Why this mountain
Rainier compresses the whole problem into one place: climate forcing, a water budget stored as ice and snow, a hydrothermal system, active faulting, steep unstable ground, and populated valleys downstream. A method that works here has been tested against nearly every process this project cares about. That is why the tooling built at Rainier is written to move to other volcanic and tectonic systems across the Pacific Northwest and Alaska.
Supported by the Jerome and Linda Paros Geohazard Center, UW College of the Environment, with collaboration from the Pacific Northwest Seismic Network, the USGS Cascades Volcano Observatory, and Rice University.
References
- Shelly, D. R., Moran, S. C., & Thelen, W. A. (2013). Evidence for fluid-triggered slip in the 2009 Mount Rainier, Washington earthquake swarm. Geophysical Research Letters, 40, 1506–1512. 10.1002/grl.50354
- Moran, S. C., Zimbelman, D. R., & Malone, S. D. (2000). A model for the magmatic–hydrothermal system at Mount Rainier, Washington, from seismic and geochemical observations. Bulletin of Volcanology, 61, 425–436. 10.1007/PL00008909
- Thelen, W. A., Allstadt, K., De Angelis, S., Malone, S. D., Moran, S. C., & Vidale, J. (2013). Shallow repeating seismic events under an alpine glacier at Mount Rainier, Washington, USA. Journal of Glaciology, 59, 345–356. 10.3189/2013JoG12J111
- Helmstetter, A., Nicolas, B., Comon, P., & Gay, M. (2015). Basal icequakes recorded beneath an Alpine glacier (Glacier d’Argentière, Mont Blanc, France): Evidence for stick-slip motion? Journal of Geophysical Research: Earth Surface, 120, 379–401. 10.1002/2014JF003288
- Allstadt, K. E., Shean, D. E., Campbell, A., Fahnestock, M., & Malone, S. D. (2015). Observations of seasonal and diurnal glacier velocities at Mount Rainier, Washington, using terrestrial radar interferometry. The Cryosphere, 9, 2219–2235. 10.5194/tc-9-2219-2015
- Allstadt, K. (2013). Extracting source characteristics and dynamics of the August 2010 Mount Meager landslide from broadband seismograms. Journal of Geophysical Research: Earth Surface, 118, 1472–1490. 10.1002/jgrf.20110
- Legg, N. T., Meigs, A. J., Grant, G. E., & Kennard, P. (2014). Debris flow initiation in proglacial gullies on Mount Rainier, Washington. Geomorphology, 226, 249–260. 10.1016/j.geomorph.2014.08.003
- Vallance, J. W., & Scott, K. M. (1997). The Osceola Mudflow from Mount Rainier: Sedimentology and hazard implications of a huge clay-rich debris flow. Geological Society of America Bulletin, 109, 143–163. https://doi.org/10.1130/0016-7606(1997)109<;0143:TOMFMR>2.3.CO;2
- Black, B. A., Pringle, P. T., & Vallance, J. W. (2025). Forest-floor burial in 1507 by the largest Mount Rainier lahar of the past millennium. Geology, 54, 189–192. 10.1130/G53721.1
- Guzzetti, F., Peruccacci, S., Rossi, M., & Stark, C. P. (2008). The rainfall intensity–duration control of shallow landslides and debris flows: an update. Landslides, 5(1), 3–17. 10.1007/s10346-007-0112-1
- Mondini, A. C., Guzzetti, F., Chang, K.-T., Monserrat, O., Martha, T. R., & Manconi, A. (2021). Landslide failures detection and mapping using Synthetic Aperture Radar: Past, present and future. Earth-Science Reviews, 216, 103574. 10.1016/j.earscirev.2021.103574
- Handwerger, A. L., Huang, M.-H., Jones, S. Y., Amatya, P., Kerner, H. R., & Kirschbaum, D. B. (2022). Generating landslide density heatmaps for rapid detection using open-access satellite radar data in Google Earth Engine. Natural Hazards and Earth System Sciences, 22, 753–773. 10.5194/nhess-22-753-2022
- Voisin, C., Garambois, S., Massey, C., & Brossier, R. (2016). Seismic noise monitoring of the water table in a deep-seated, slow-moving landslide. Interpretation, 4, SJ67–SJ76. 10.1190/INT-2016-0010.1
- Kramer, R. L., Thelen, W. A., Iezzi, A. M., Moran, S. C., & Pauk, B. A. (2024). Recent expansion of the Cascades Volcano Observatory geophysical network at Mount Rainier for improved volcano and lahar monitoring. Seismological Research Letters, 95, 2707–2721. 10.1785/0220240112
- Manos, J.-M., Gräff, D., Martin, E. R., Paitz, P., Walter, F., Fichtner, A., & Lipovsky, B. P. (2024). DAS to discharge: using distributed acoustic sensing (DAS) to infer glacier runoff. Journal of Glaciology, 70. 10.1017/jog.2024.46